
WATER MADDERS
Louisiana Water Sample / Madder Root Dye Bath Tests
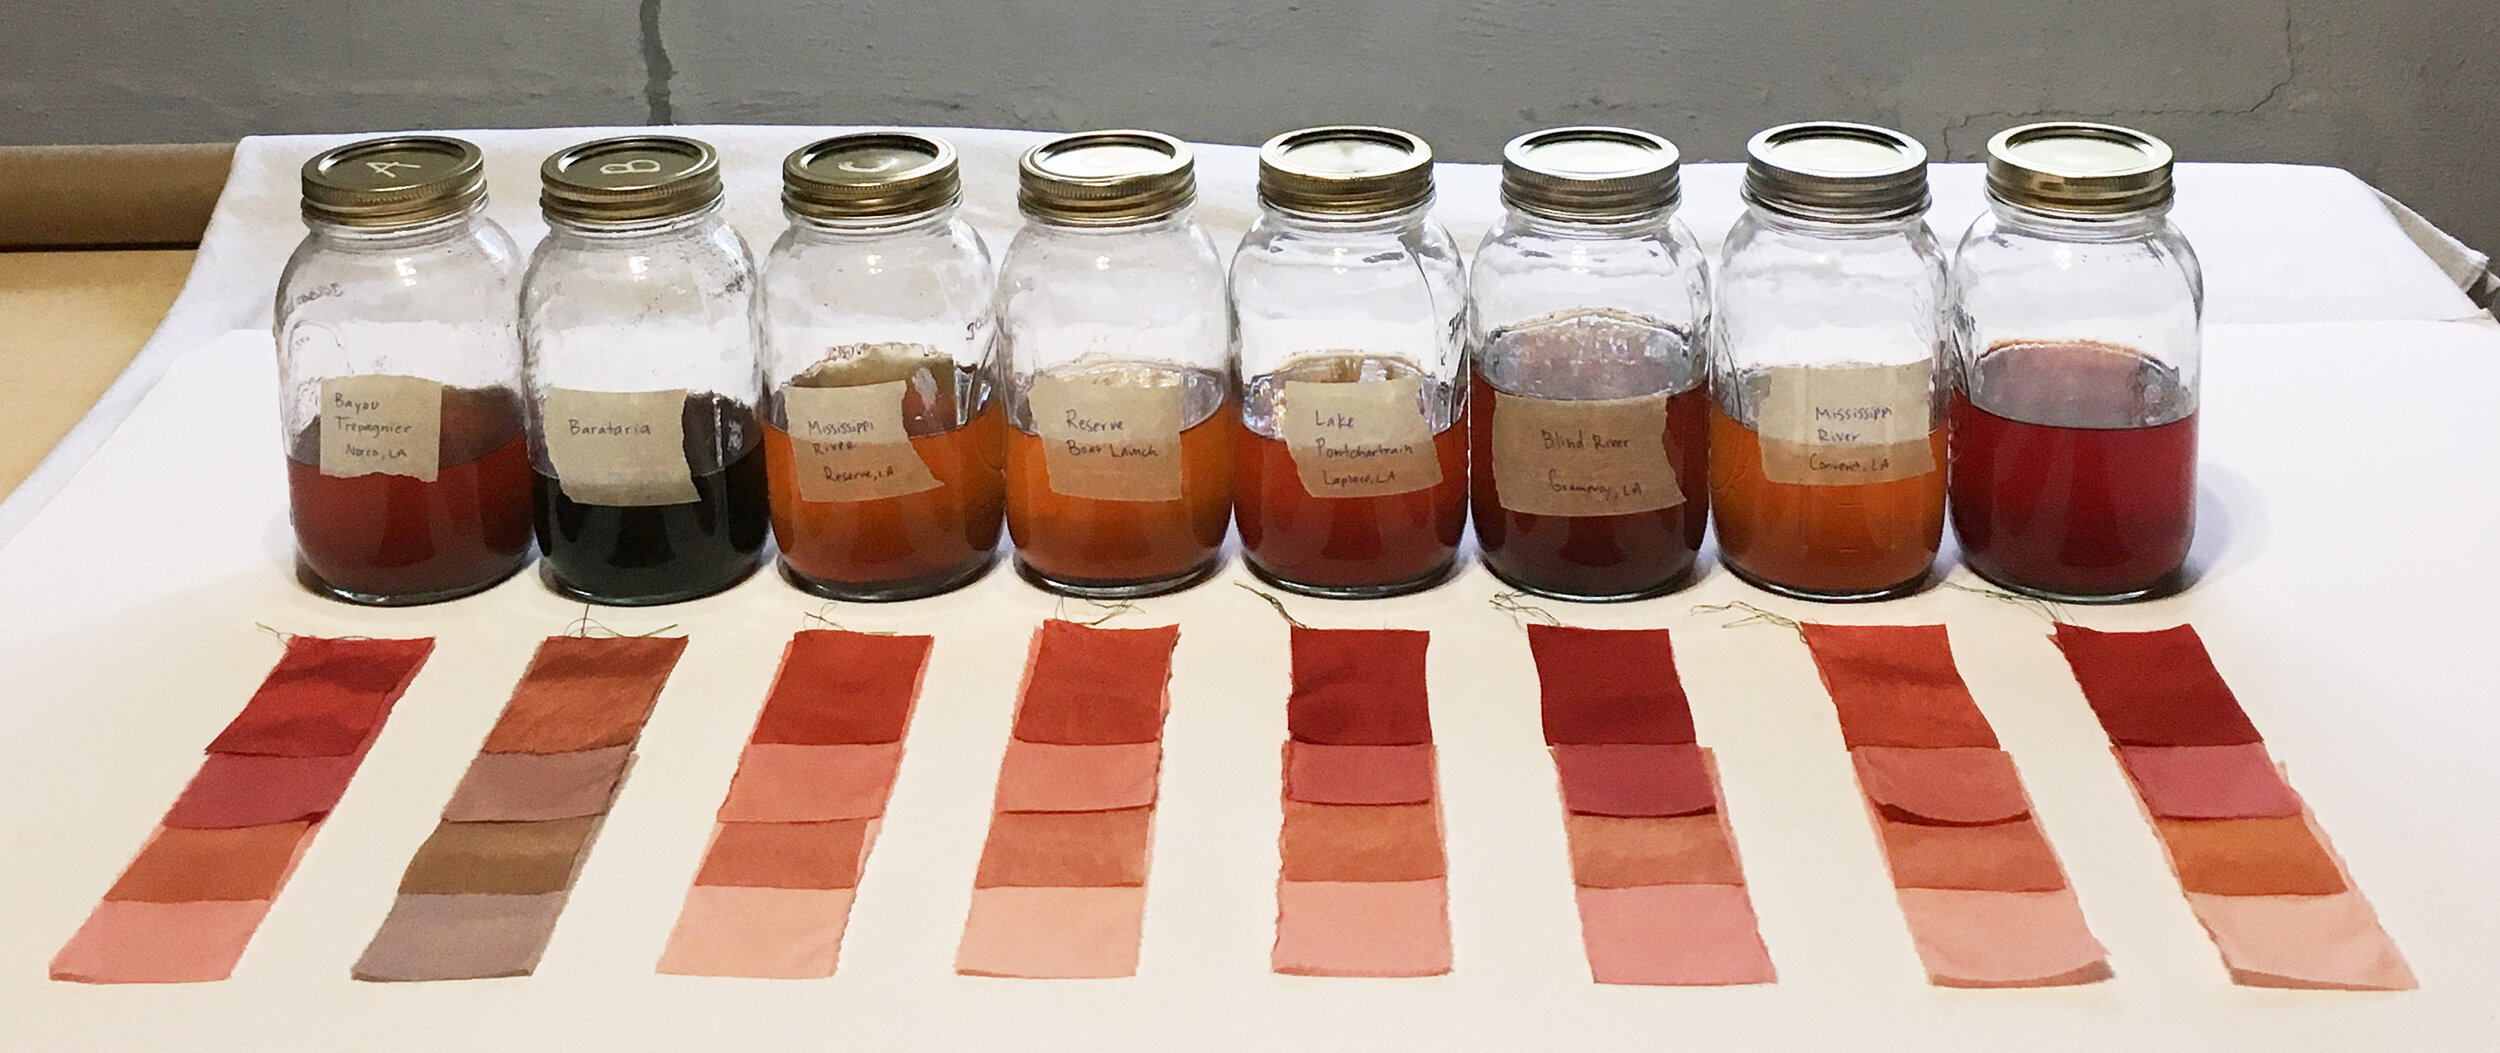
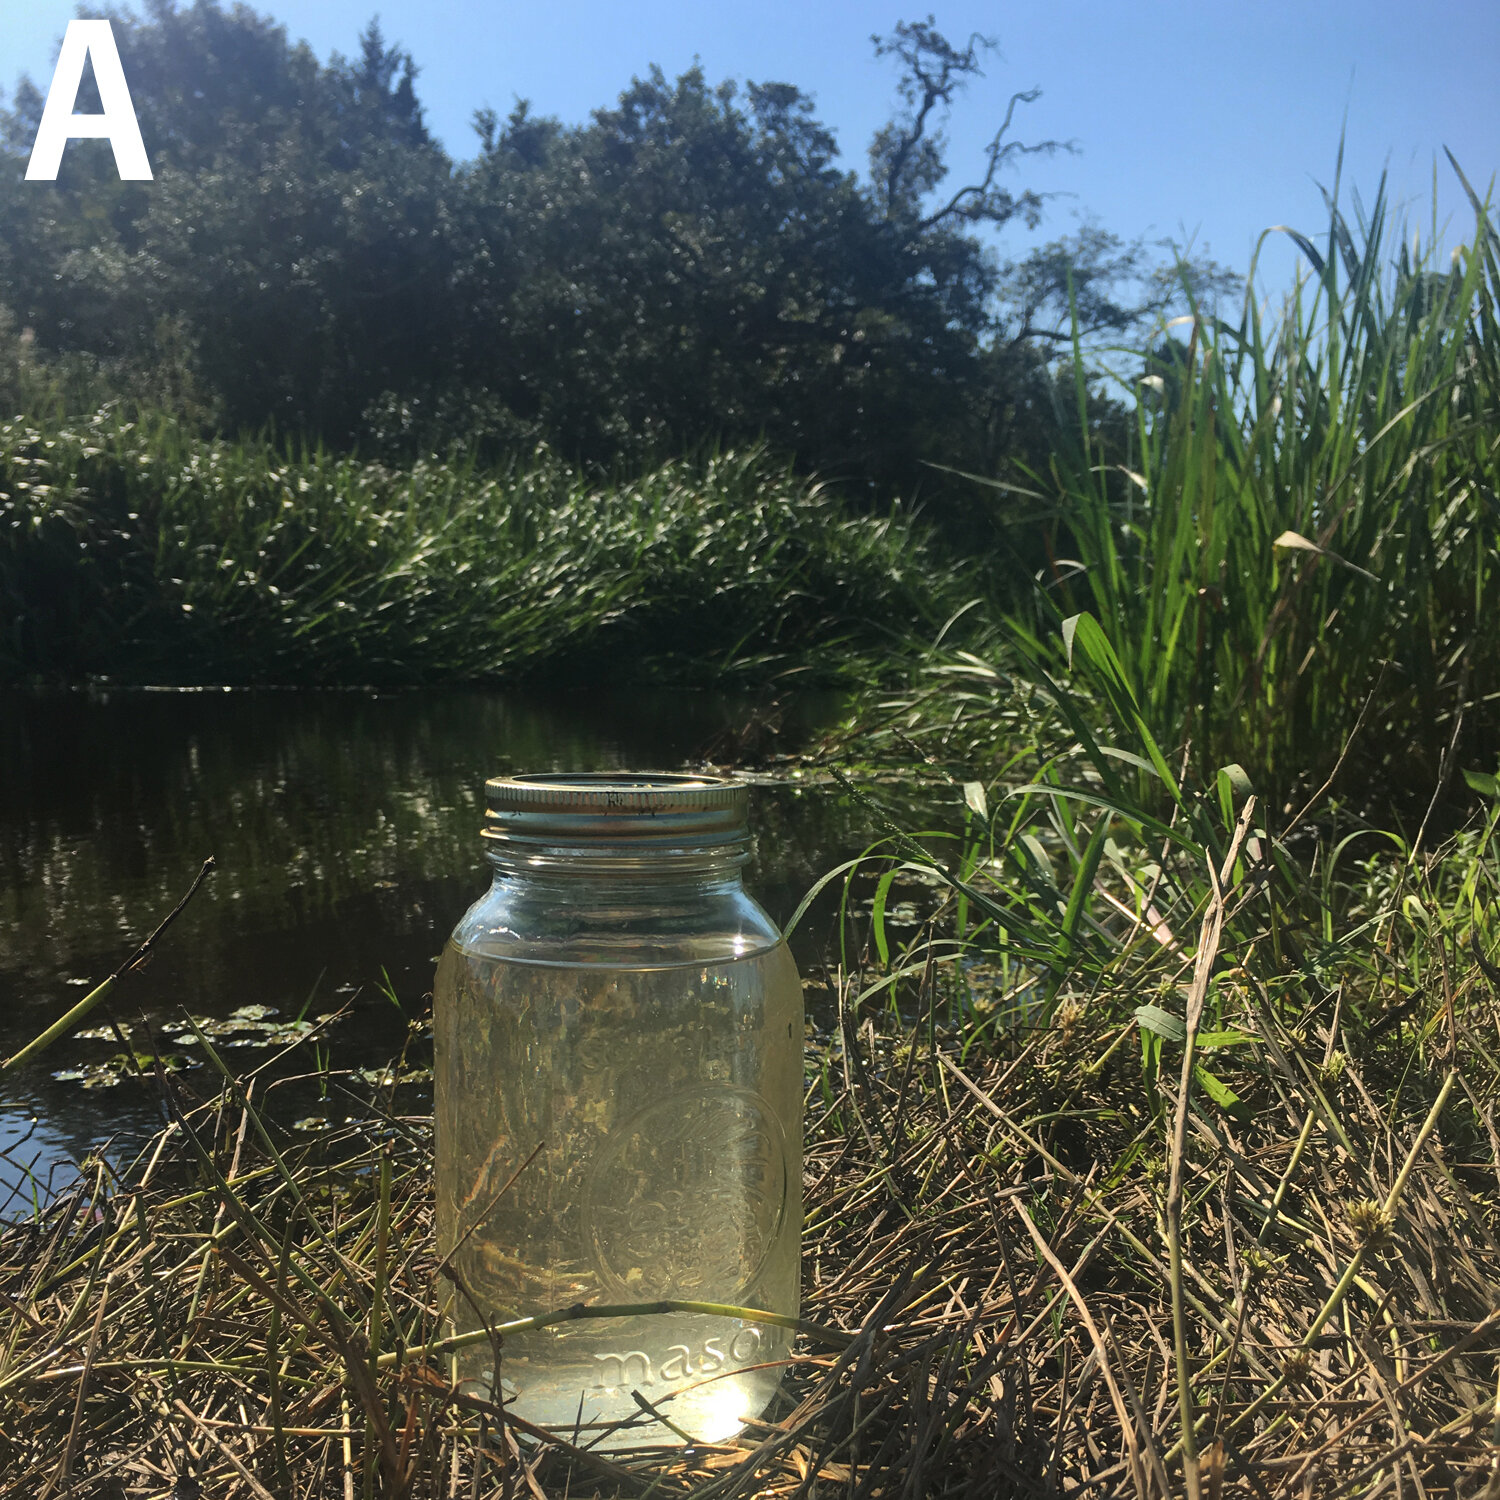
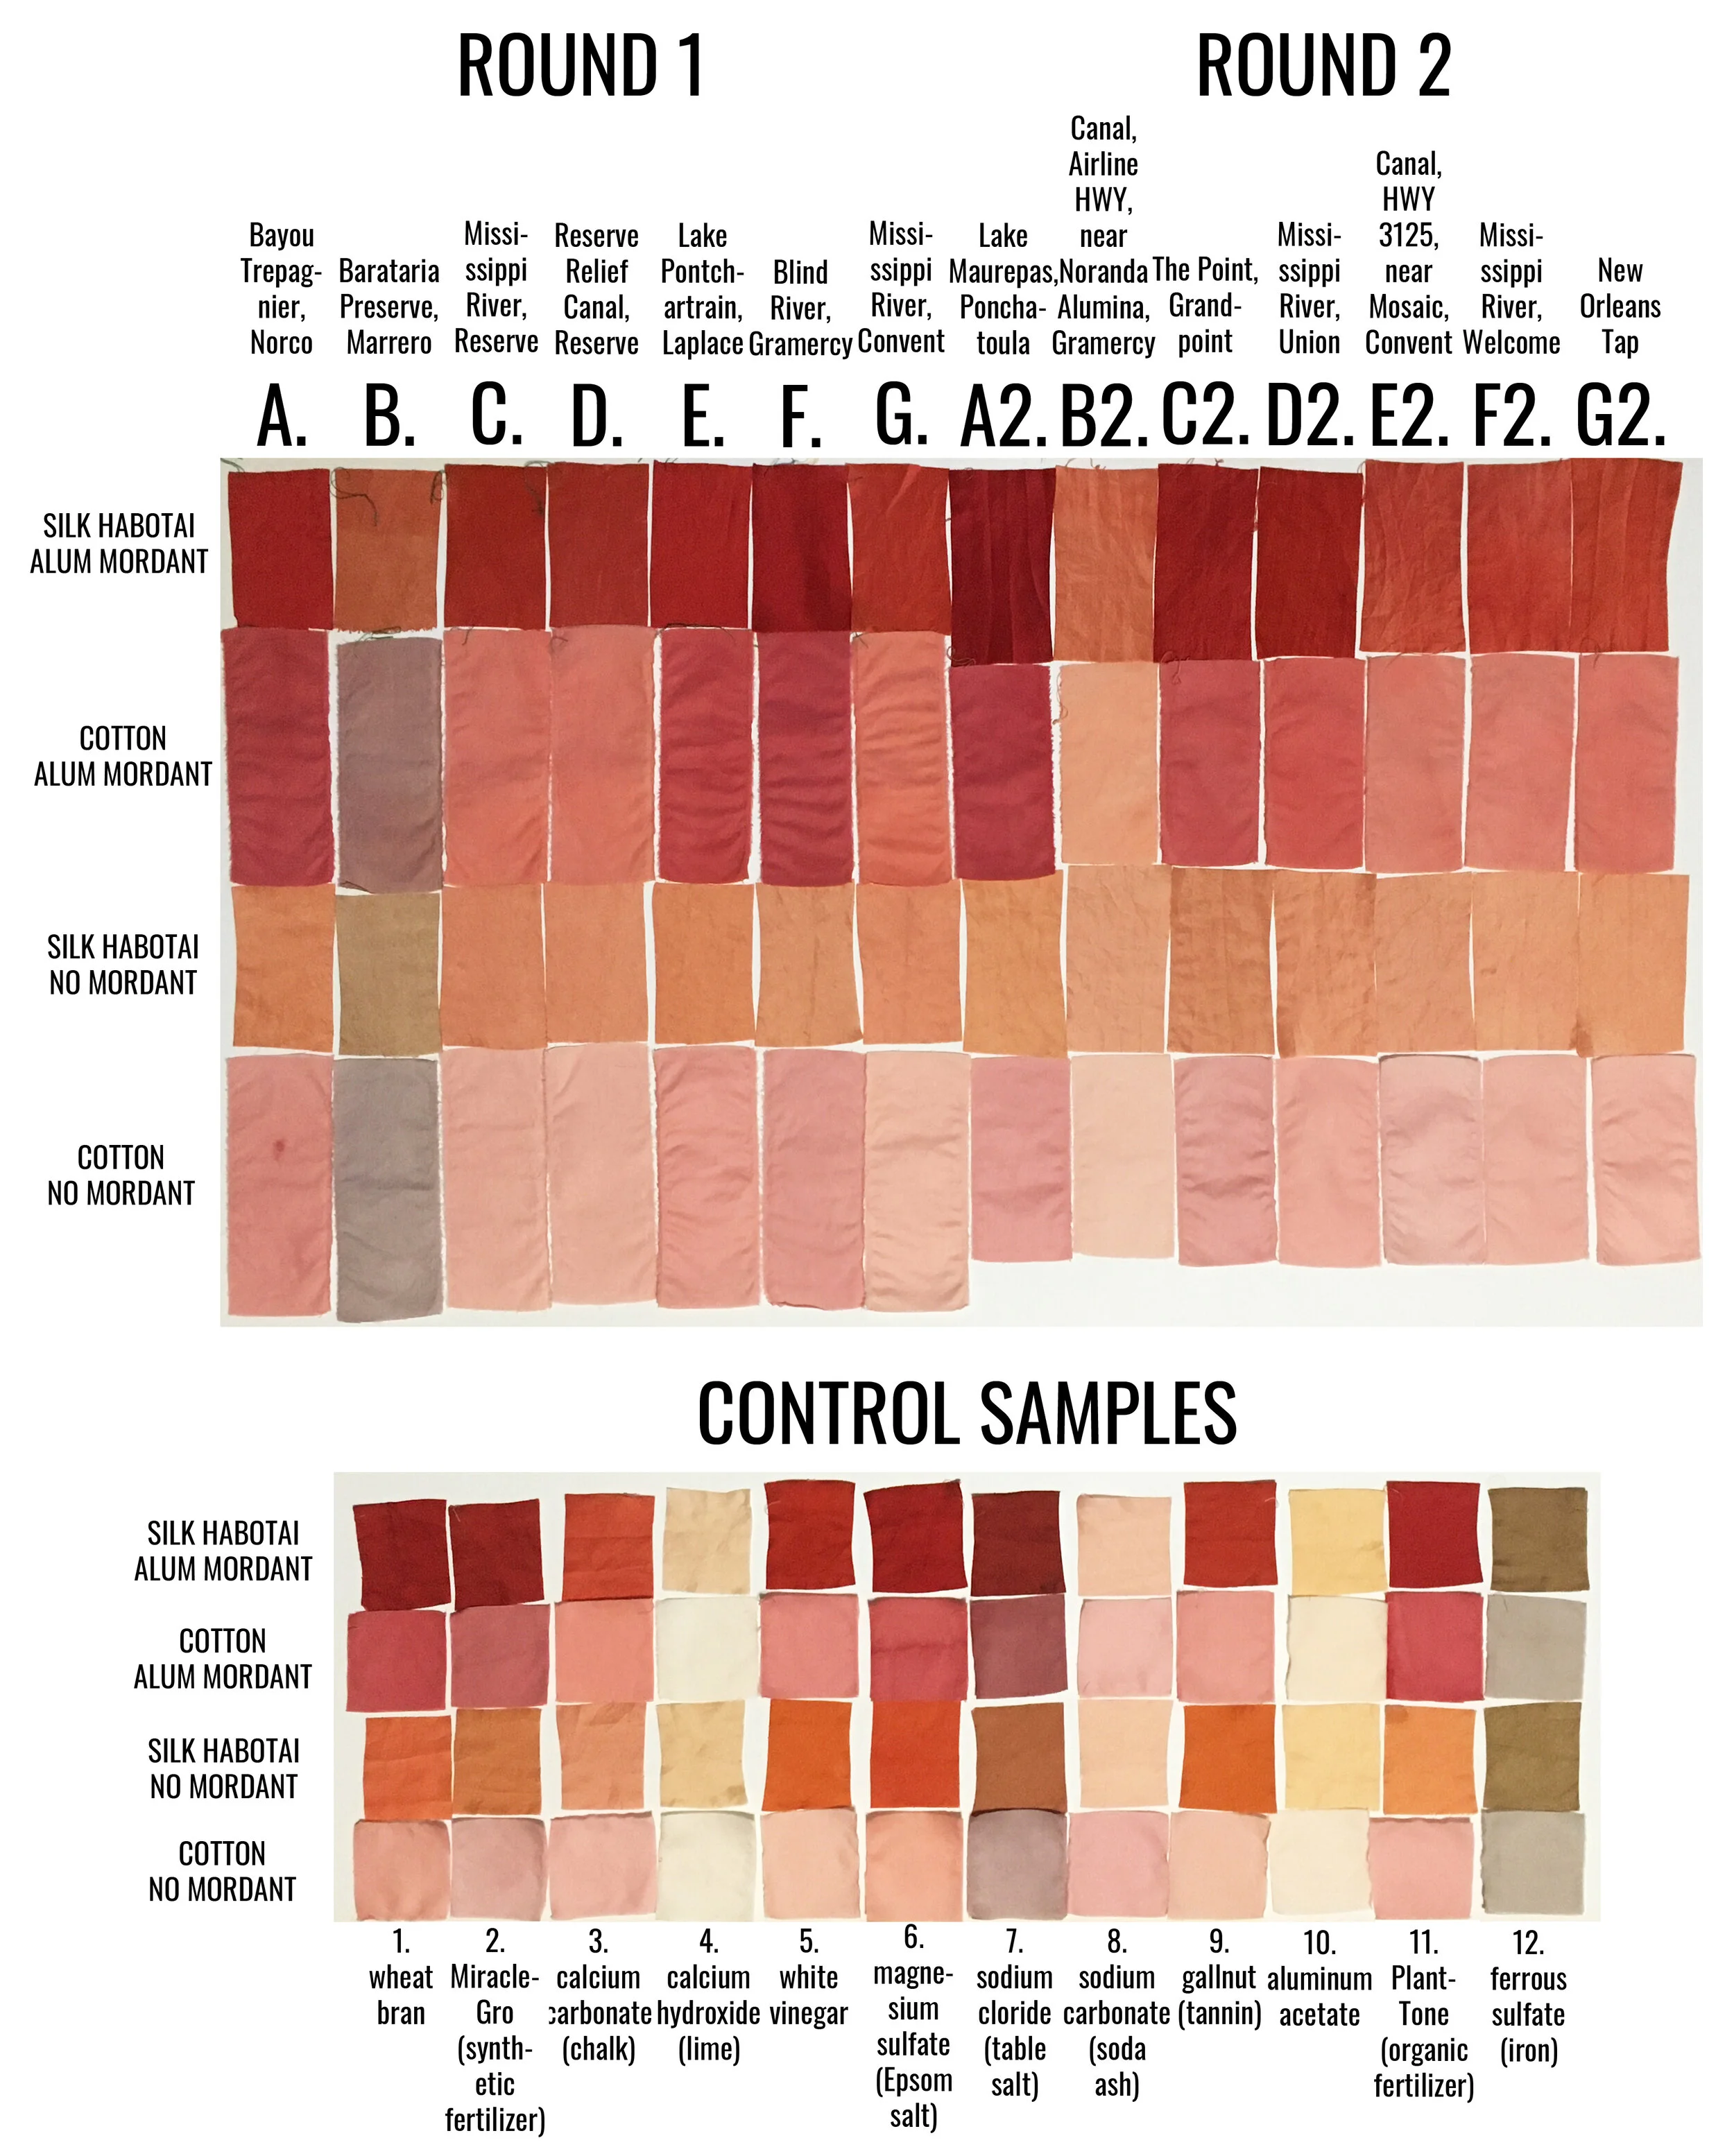
This project is an ongoing survey of the water quality in Cancer Alley using the natural dye, madder root (Rubia tinctorum), as a vehicle for this exploration. Cancer Alley is a region in Louisiana that contains a high number of petrochemical plants, all permitted by the state to emit and release toxic substances into the air, land and water; a region that also has high rates of cancer. Madder is a plant whose roots contain a large number of natural color molecules that react to water contents, shifting the final color outcome, which can be seen with the naked eye. I started this project because I wanted to see if I could use this natural dye to determine and visually demonstrate the contents of various bodies of water across this particularly polluted region in Louisiana. I have been collecting surface water samples from various rivers, bayous, lakes and canals throughout the region, using the samples to create madder root dye baths and observing how the contents of the water manipulates the final dyed fabric results. So far, I have completed two rounds of water collecting and dye testing. Below is a map of my collection sites from round 1 (A-G) and round 2 (A2-G2).

Map of collection site locations.


Cancer Alley
Map of industrial facilities located in Cancer Alley. Sourced from the Tennessean created by Michael Orr/Louisiana Environmental Action Network.
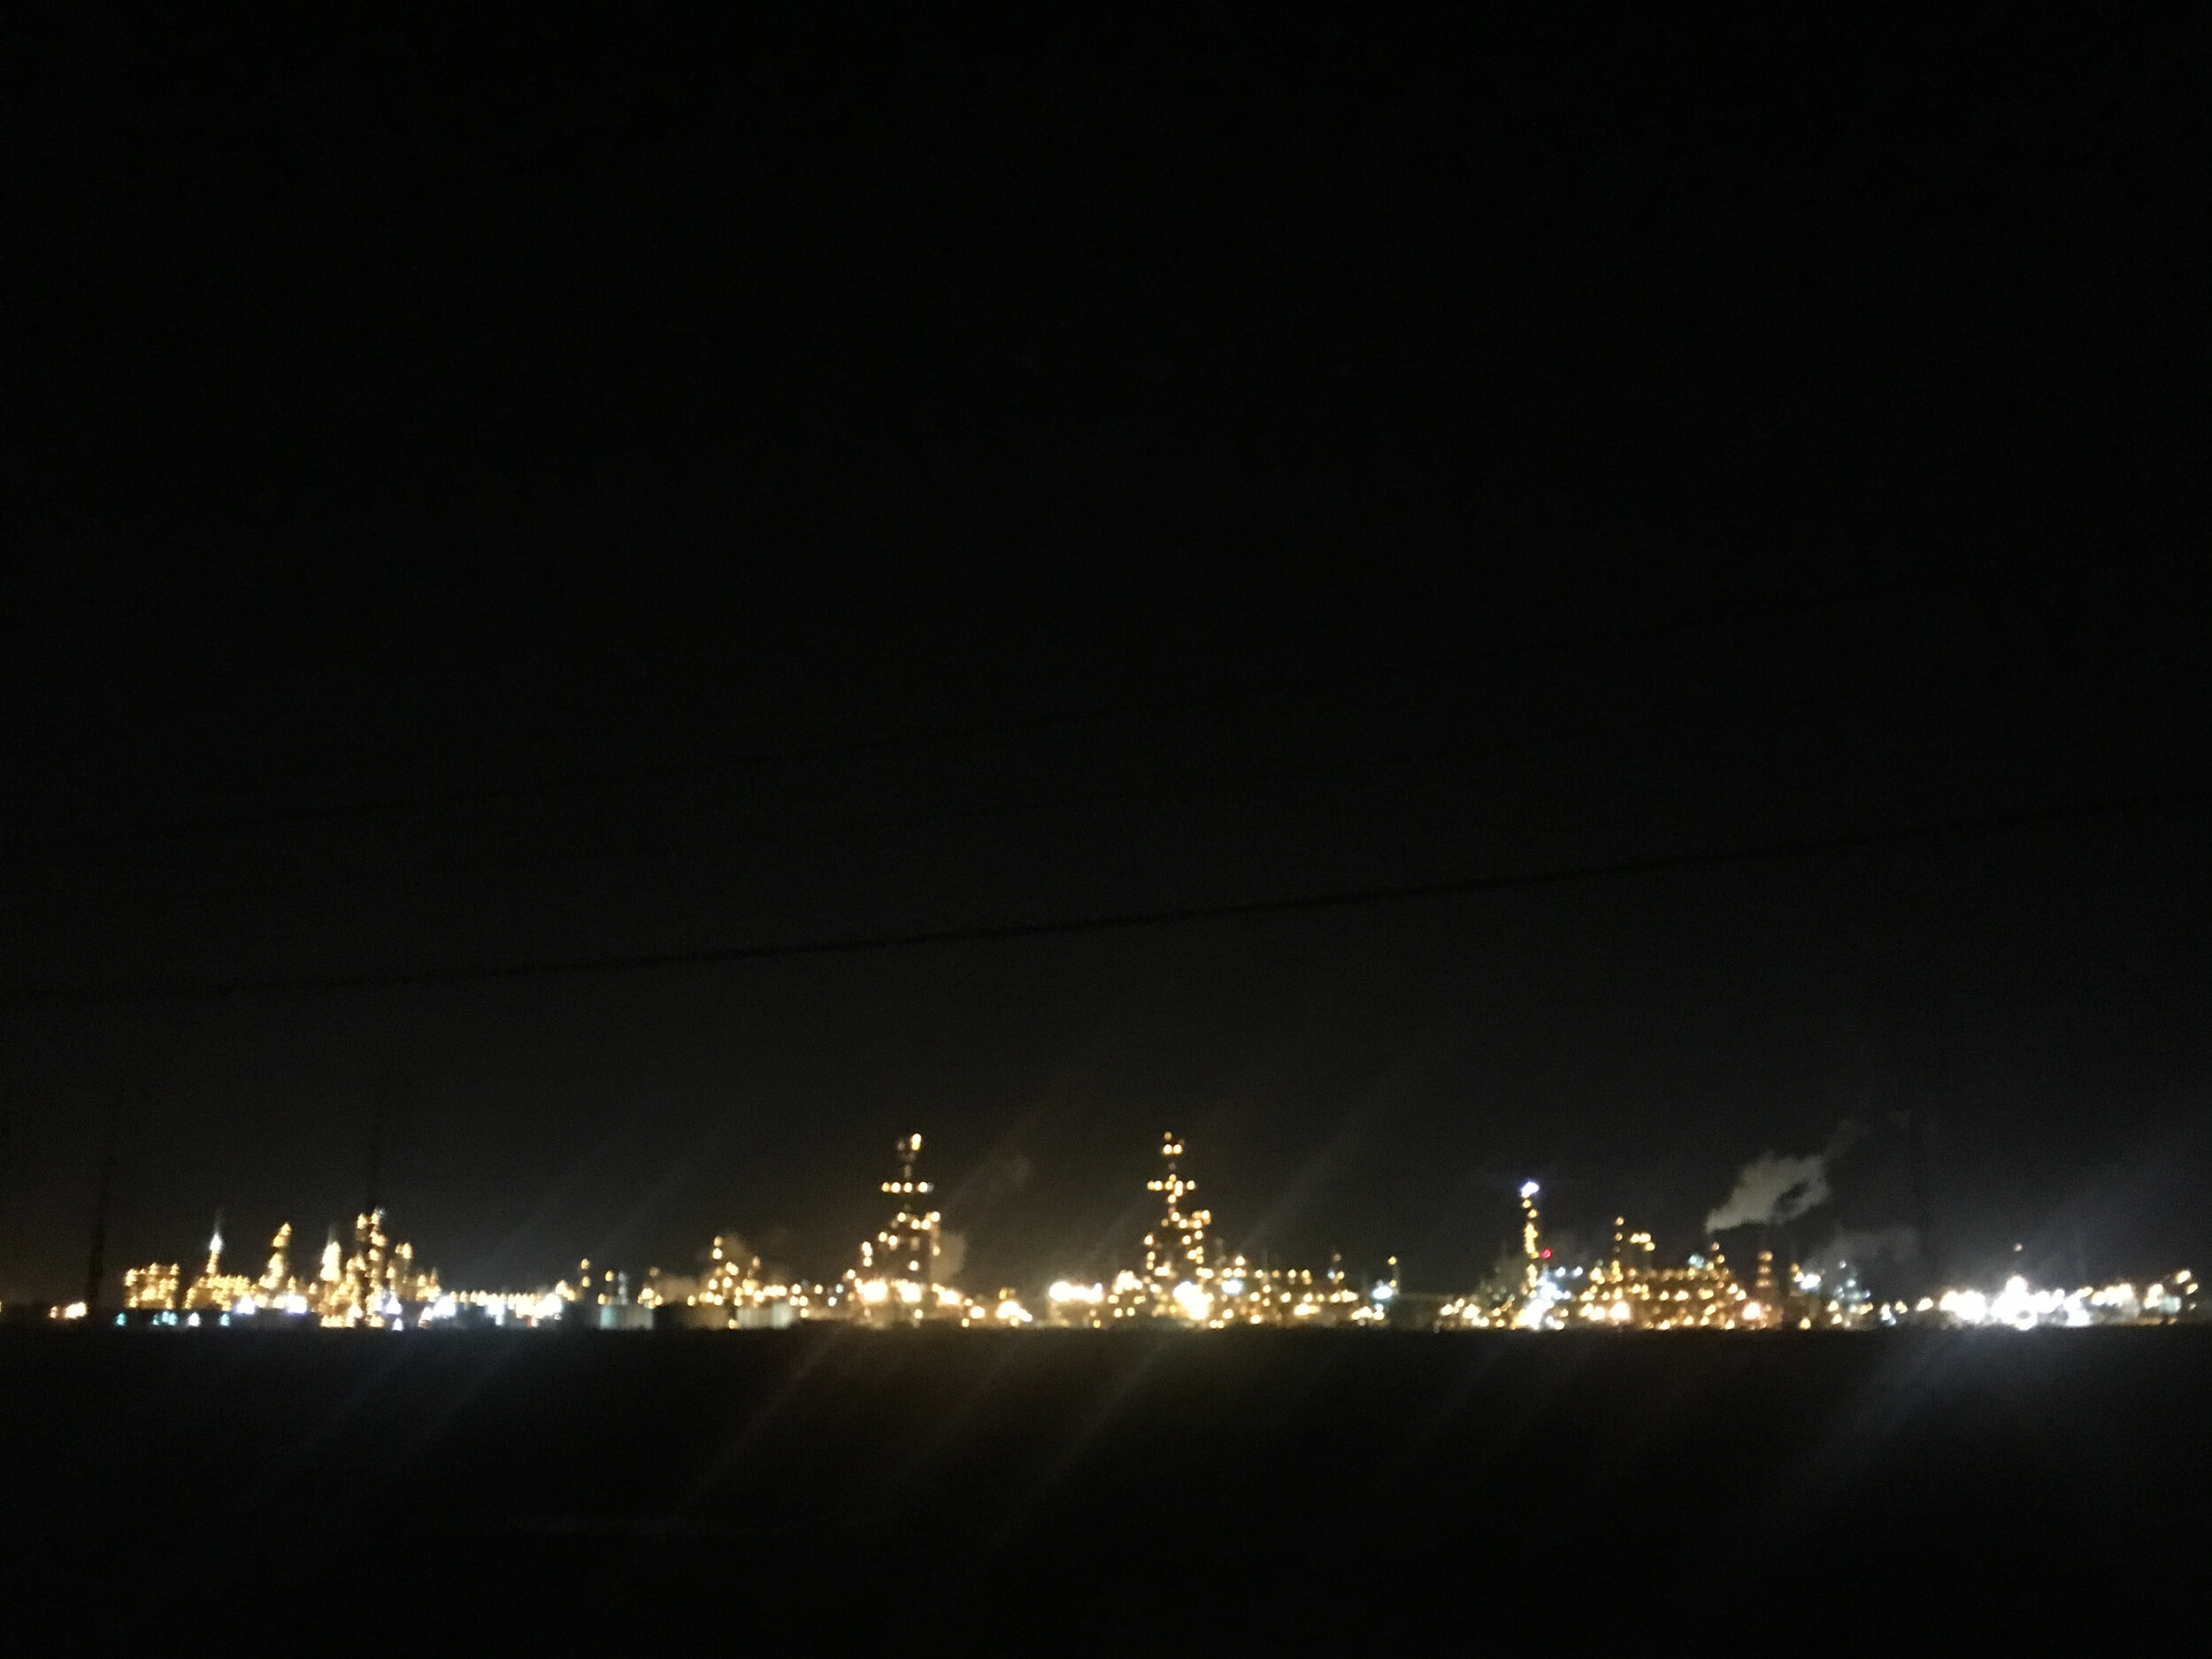
Cancer Alley, the Chemical Corridor, the River Parishes, or as I personally call it, home (although I don’t currently live there), is the 150 mile stretch of the Mississippi River between Baton Rouge and New Orleans (or 85 miles rolling down I-10). This region is saturated with petrochemical plants, refineries, holding warehouses and tanks and other industrial facilities within local communities. Residents are heavily impacted by a myriad of pollutants released both legally and illegally by these facilities. Long-term exposure to pollutants gravely affects the health and well-being of the residents in these communities. Construction of new plants are on the rise, displacing schools, parks, wetlands, cemeteries and homes. The majority of these facilities are located in predominantly Black communities. These communities are often taken advantage of, dismissed and overlooked by state and local politicians who wish to pave the way for incoming industry.


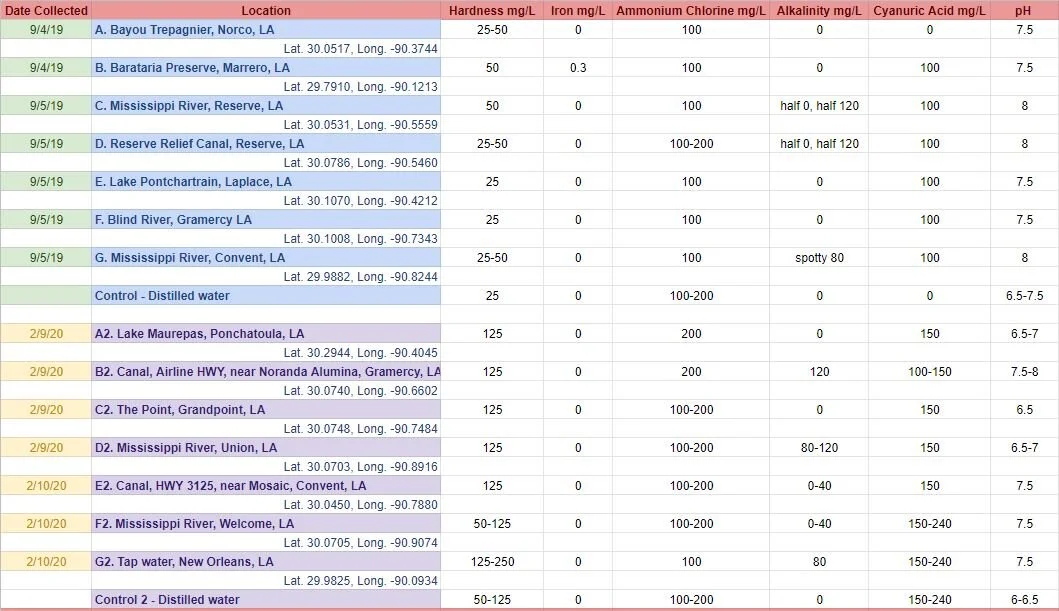
Water Quality
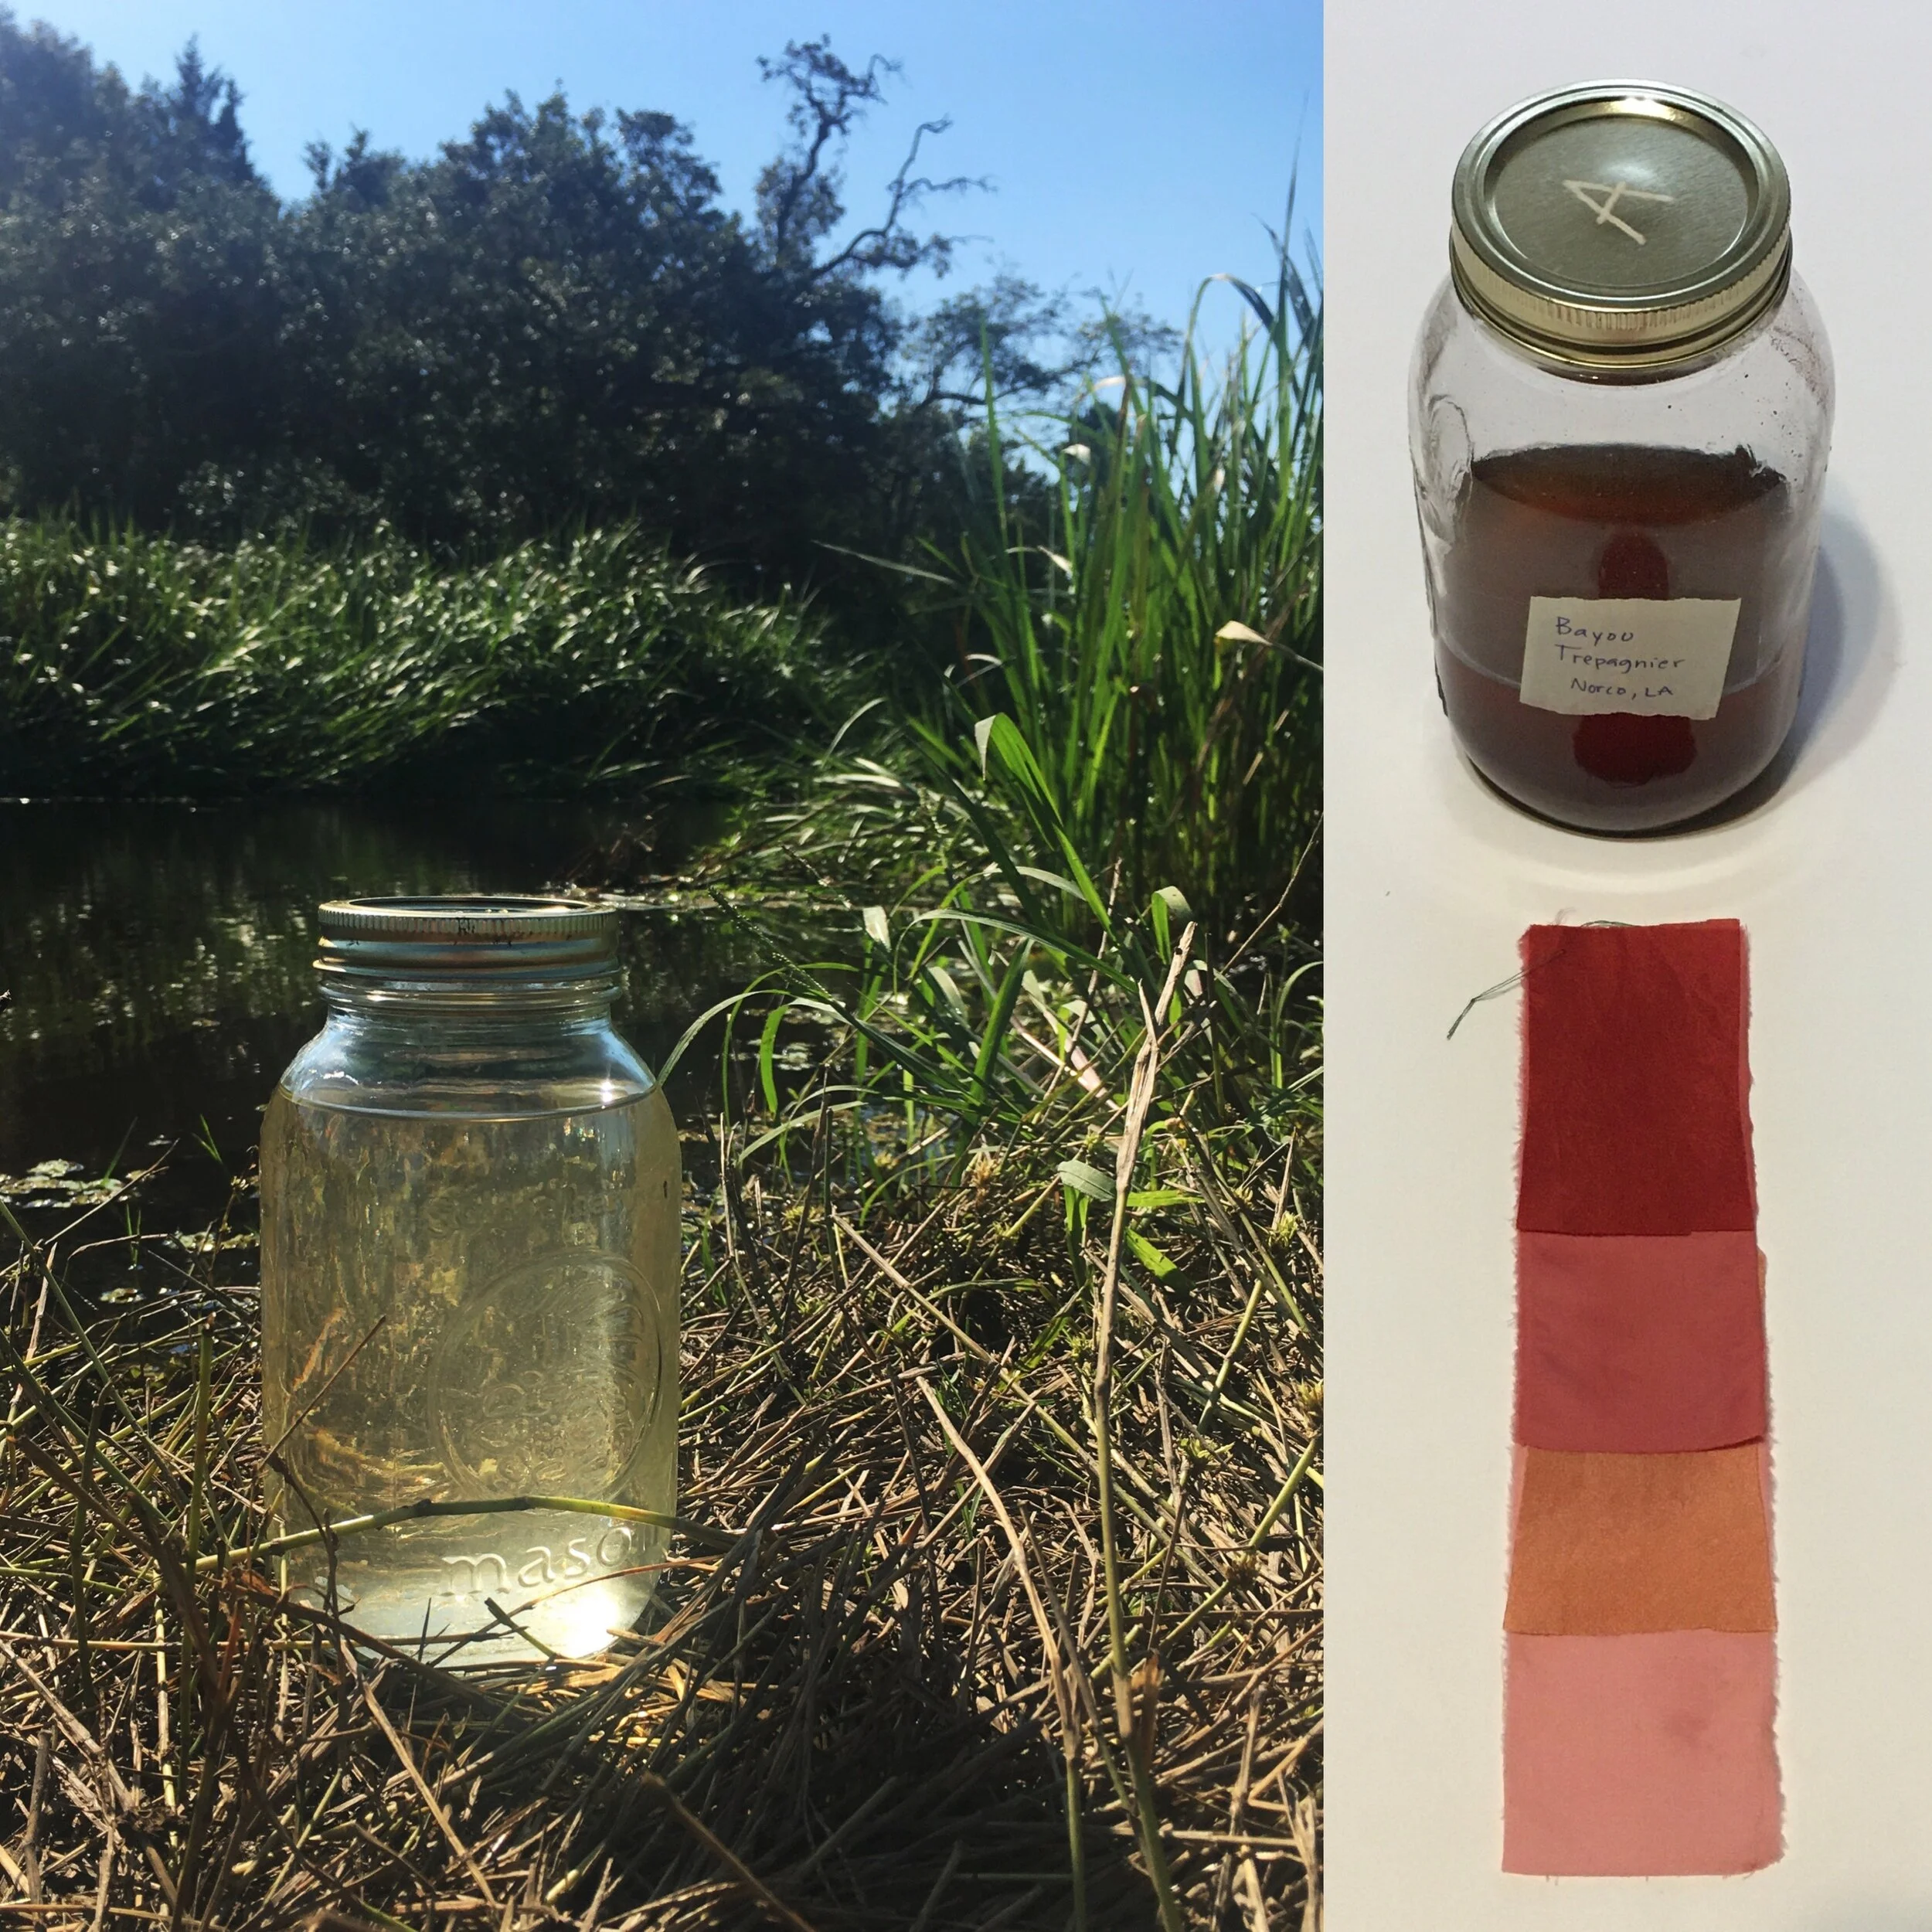
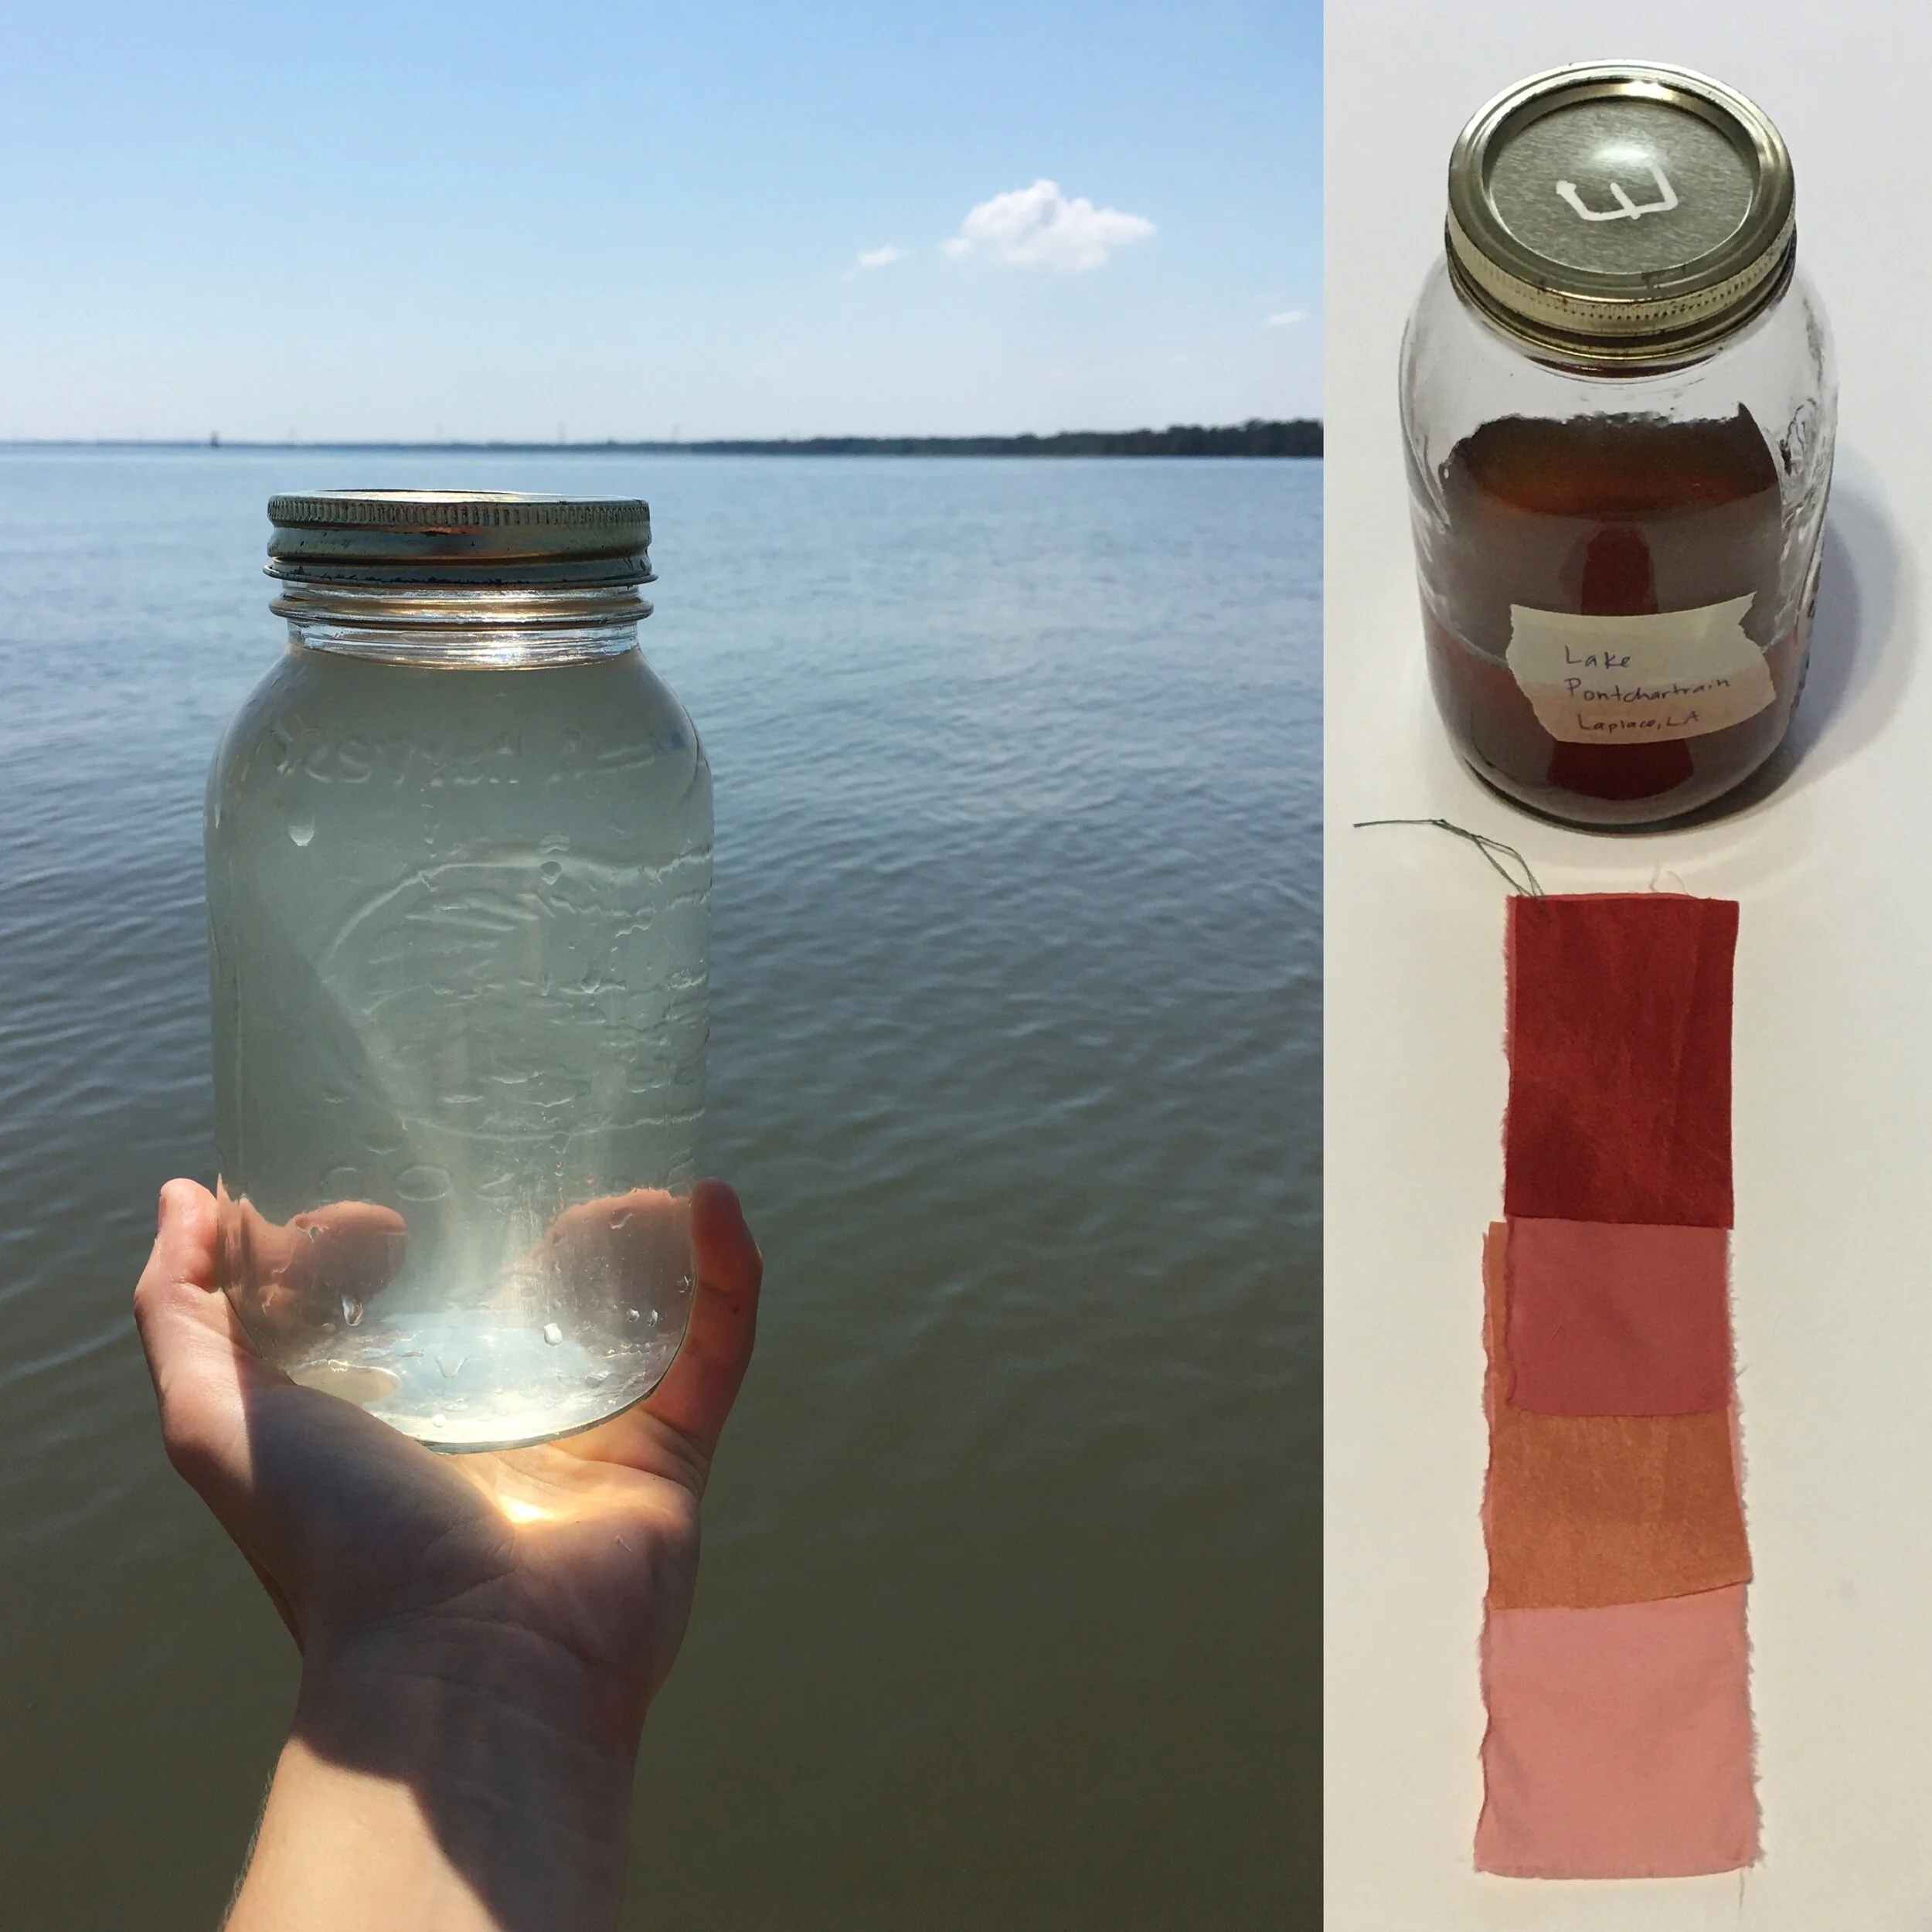
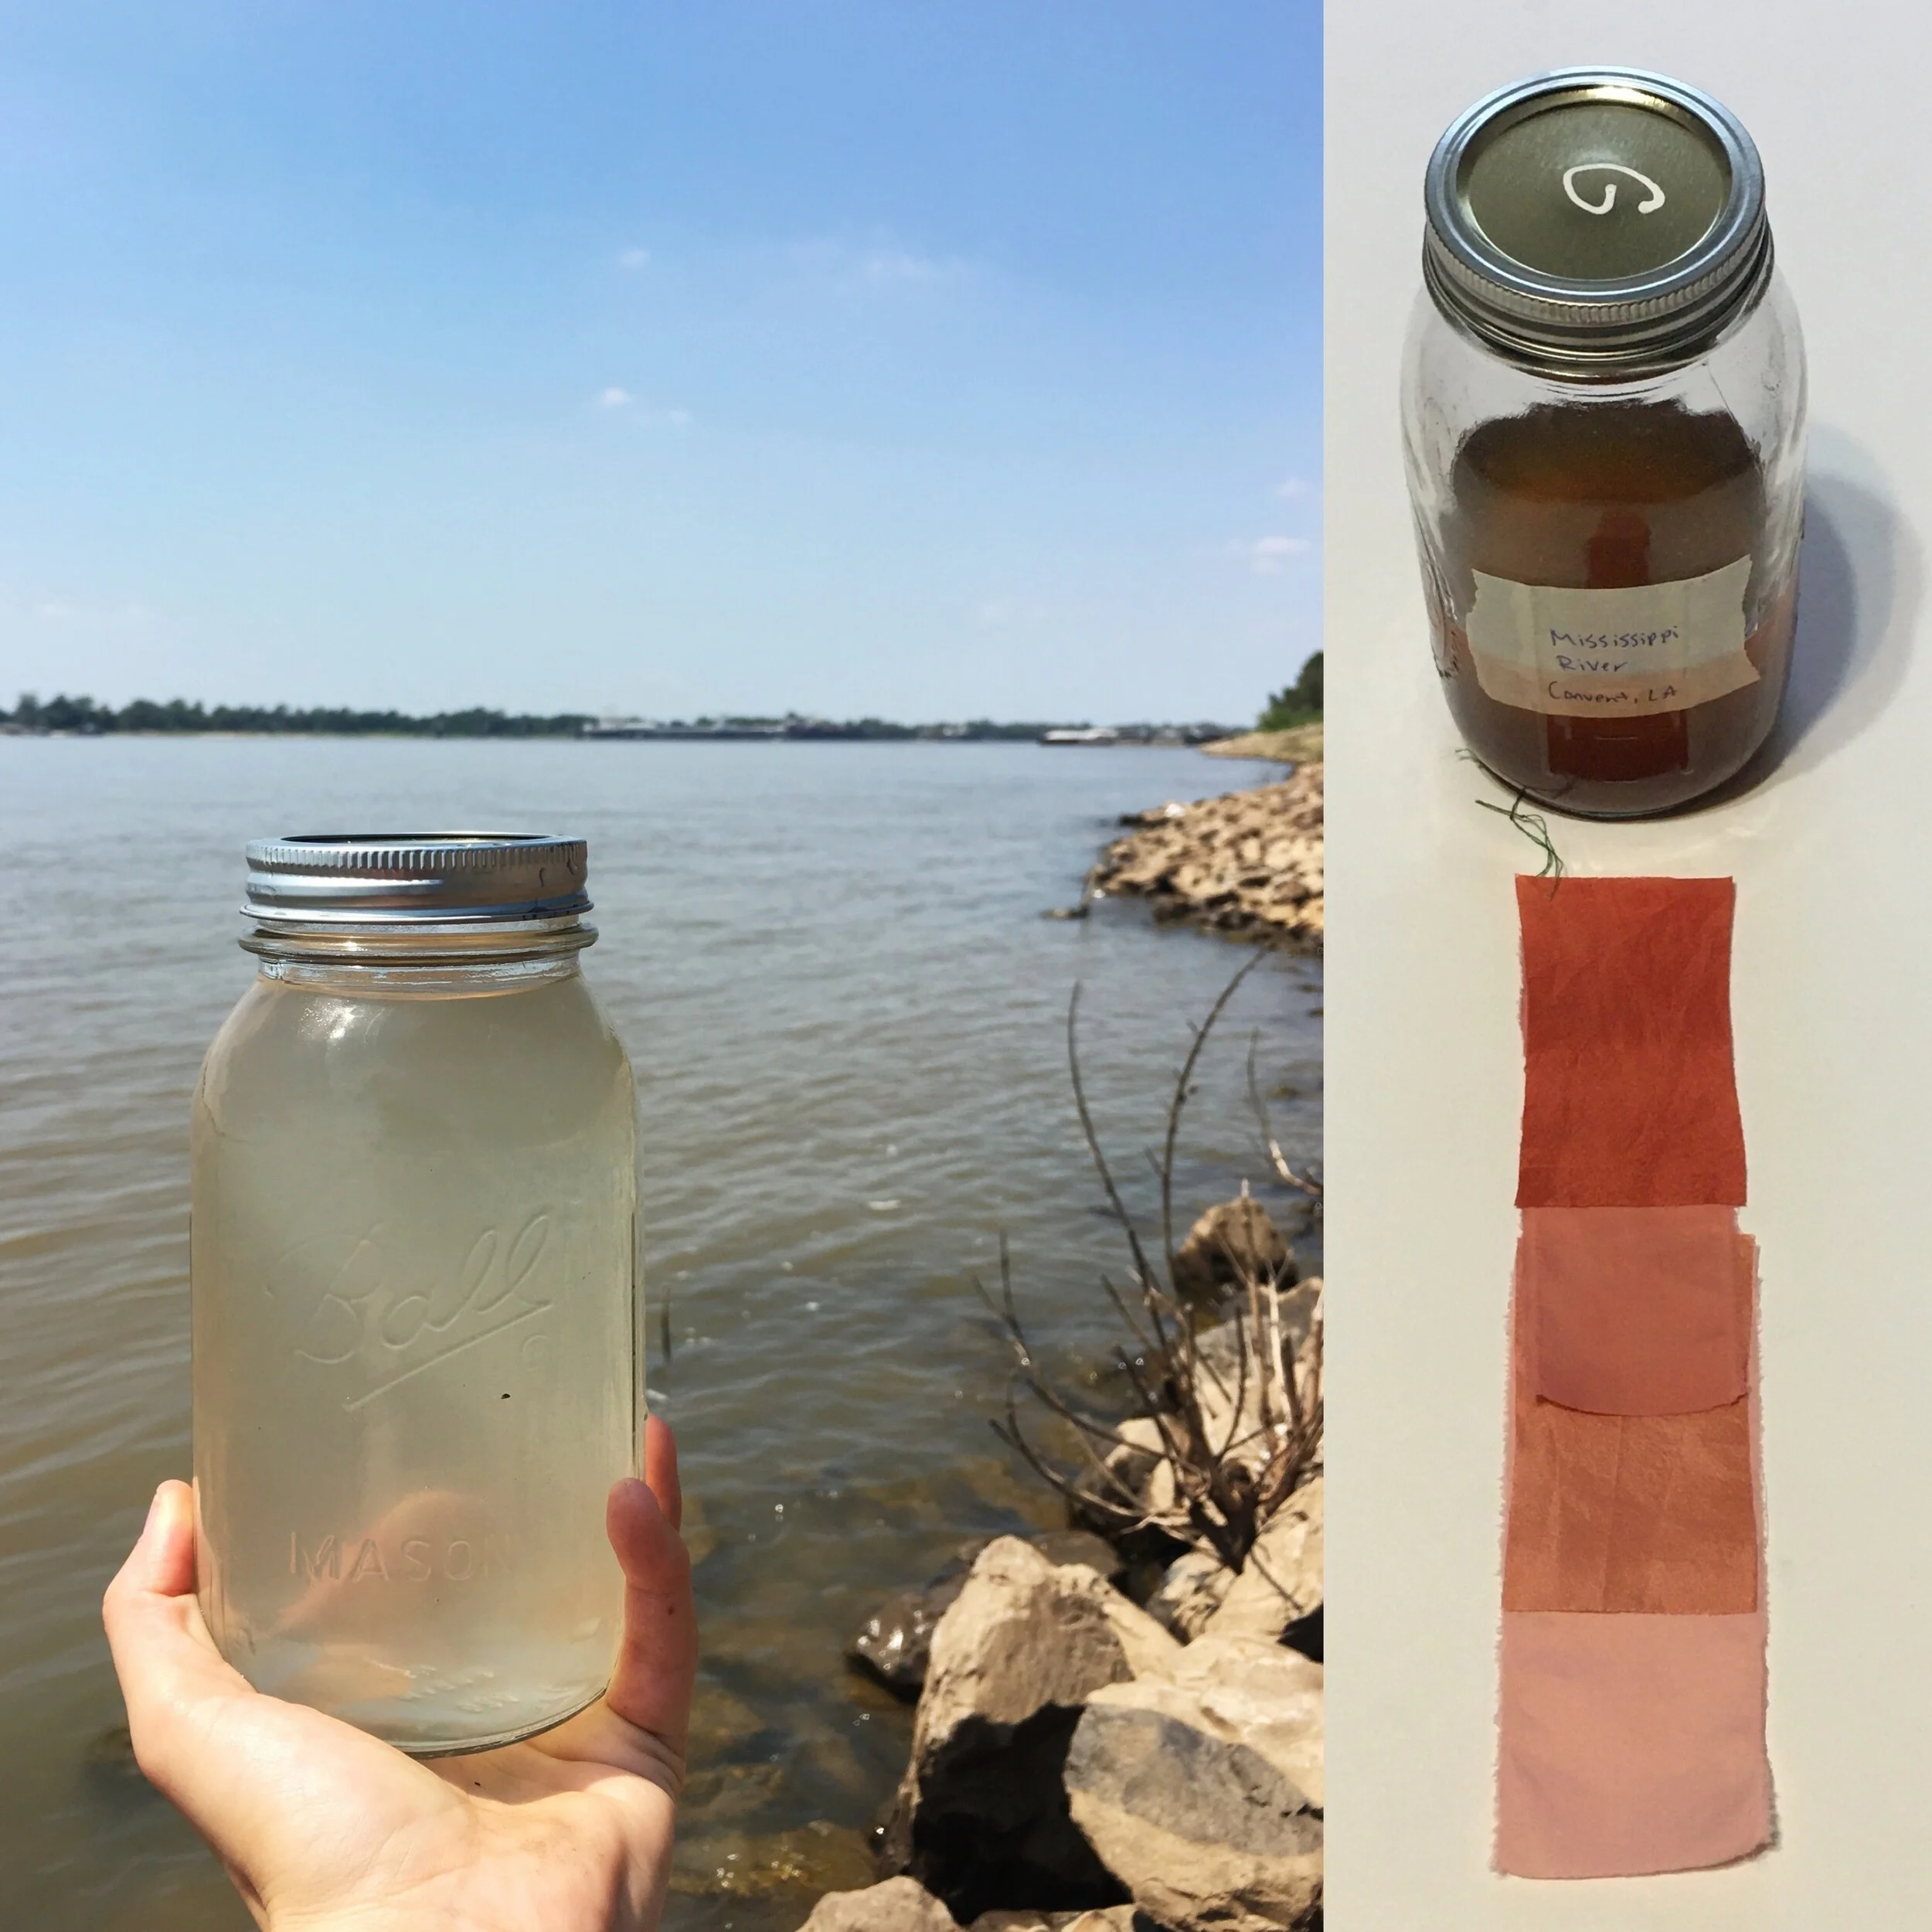
For this project, I collected a one liter mason jar full of surface water from various bodies of water located in the area (predominantly St. James and St. John the Baptist Parishes). Most natural dyes are sensitive to water quality, including variations in pH, alkalinity, hardness, the presence of tannins as well as metals and other minerals. In general, all non-purified water naturally contains various substances that will affect the outcome of a dye bath.
But in Cancer Alley, plants are permitted by the state to utilize the Mississippi River, back swamps and bayous to discharge their waste waters (both treated and not). Because most of the region’s water bodies are in some way connected to one another, either by rivers or man-made canals and ditches, the spread of toxic waste pollution is pervasive adding minerals, chemicals and toxic compounds to these waters. In fact, many of the rivers, lakes, bayous and swamps in Louisiana are listed as impaired by the state.
I located the relevant Louisiana Pollutant Discharge Elimination System permits (LPDES) through the Louisiana Department of Environmental Equality’s (LDEQ) website. These permits are public record and cite the discharge sites, called “outfalls,” as well as the pollutants they are allowed to emit and are mandated to monitor through weekly, monthly, or annual Discharge Monitoring Reports (DMRs). The facilities themselves are charged with monitoring and reporting their own discharges, rather than independent regulators.
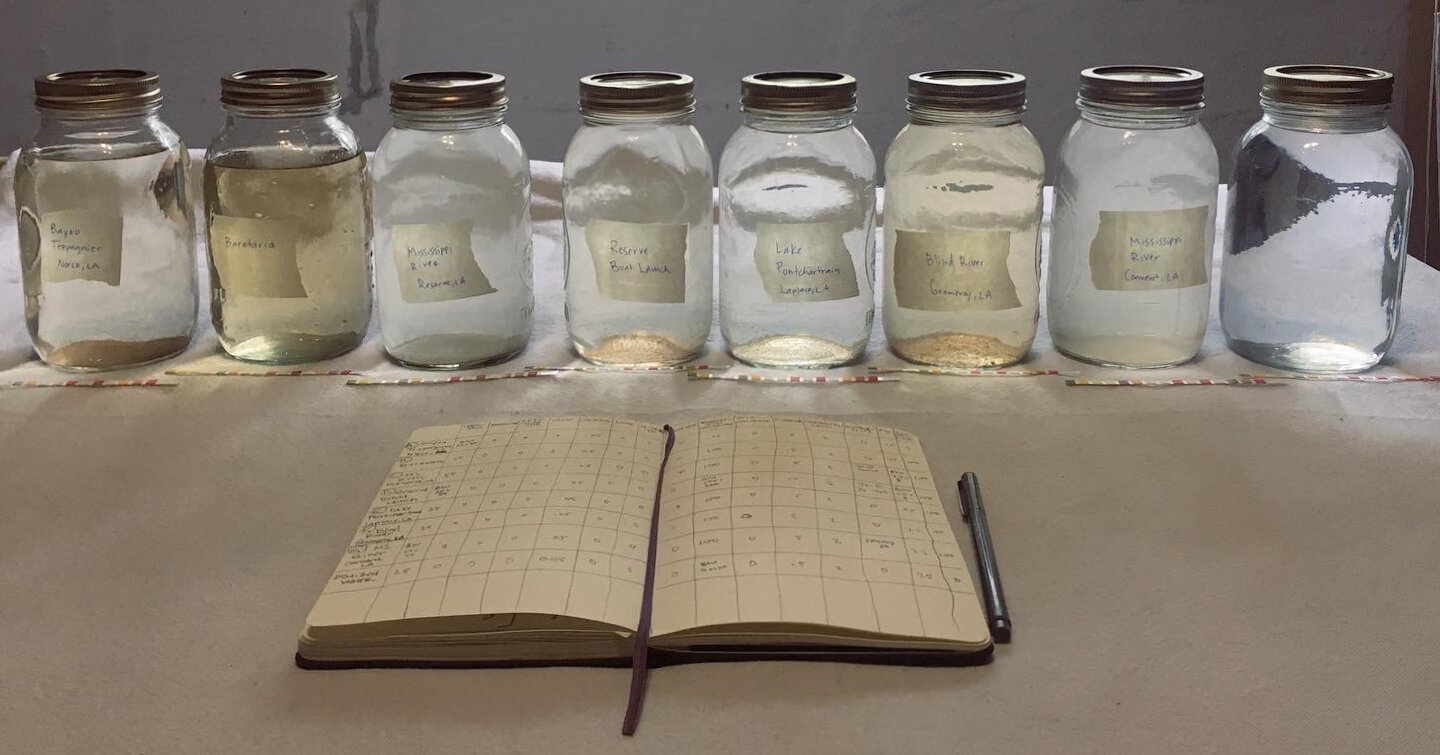
Round 1 water samples after testing with water quality test strips.
After collecting the water samples, I tested each sample with water quality test strips I purchased online. This way, I would have something relatively concrete to compare my dyed results to. The test strips were slightly hard to read, which is why some entries include a span of values, rather than just one definitive value. There were many substances that I was not able to test for. Intermittent water quality tests completed by the LDEQ starting in the 1960s show widely fluctuating levels of mercury, chromium, chloride, cadmium, arsenic, copper, lead, iron and nickel at one site in Blind River in St. James Parish. Those tests also show trace levels of synthetic compounds such as 1,1,1-trichloroethane, 1,1,2,2-tetrachloroethane, 1,1,2-trichloroethane, 1,1-dichloroethane, 1,2-dichloropropane, 1,4-dichlorobenzene, bromodichloromethane, among others. Additionally and more recently, the EPA’s Toxics Release Inventory for 2019 shows water releases of ammonia, zinc, methanol, chlorine, Bis(2-chloroethyl)ether, dioxin, asbestos, xylene, benzene, toluene, nitrate compounds, chloroprene and more, released in St. James and St. John the Baptist parishes. The water sample test strips I purchased online couldn’t measure most of these substances.
Below is a graph of my water quality test strip results. For each round, I also included a ‘control’ sample, using distilled water as the base for the dye bath.
Madder Root, A Natural Dye
Madder is a herbaceous plant whose long network of perennial roots have been used historically to obtain a rich and fast red dye color. The dried roots contain multiple dye compounds which can produce a variation of hues from a very pure red to an array of oranges, pinks, browns and purples, depending on where the plant is grown, how the root is processed and what’s in the water of the dyebath. I used ground madder (Rubia tinctorum), for all of these tests, all from the same source and batch.

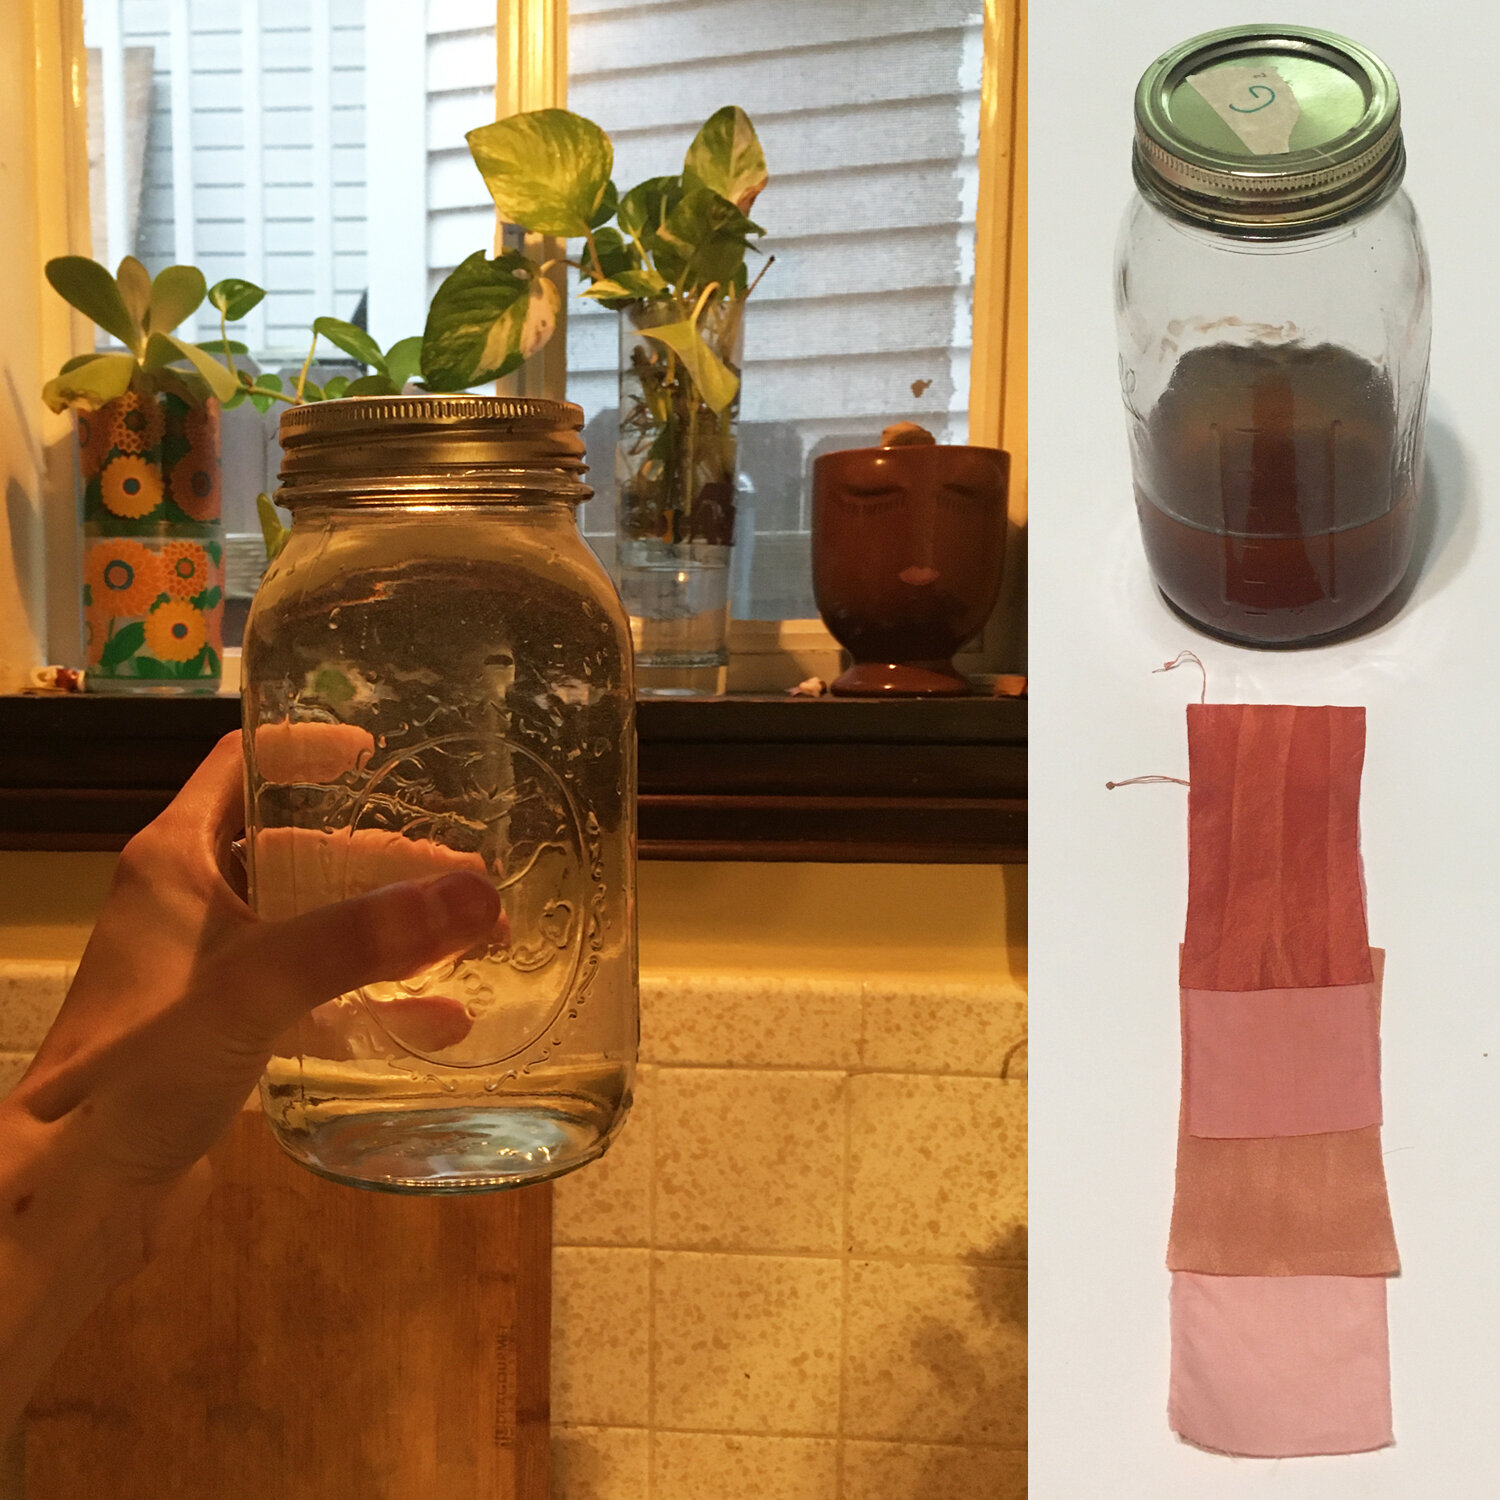
Round 1 water samples after a tablespoon of ground madder root was added and allowed to soak overnight.
I chose to include 4 fabric swatches in each dye bath, including two swatches of silk habotai (protein fiber) and two swatches of cotton (cellulose fiber), one of each was treated with an alum mordant, and the others left unmordanted. Silk and cotton take up dye differently - silk has a greater affinity for dye, while cotton generally does not. Fibers treated with a mordant and fibers left unmordanted also take up dye differently - mordanted fibers hold more dye. You’ll notice this in the results.

Unmordanted (left) and alum mordanted (right) undyed fabric swatches.
A mordant is a metal salt that is used to fix a dye to a fiber and is often used in natural dye practices to achieve light and wash fastness. The mordant attaches itself to the fiber and the dye attaches itself to the mordant. The mordanting process is generally done before the fiber is placed in the dye bath, otherwise if a mordant is placed in a dye bath (specifically one with a neutral or higher pH), the mordant will attach to the dye, rather than to the fiber, resulting in either a lighter or no dye color on the fiber. A mordant can also shift the final color outcome. Typical mordants include potassium aluminum sulfate (alum), aluminum acetate, iron, copper and less often, tin and even less often, chrome. Tannins, which are different from mordants, can also be used to prepare fibers before the dyeing process. Tannins can be found in the bark, leaves and seeds of a large variety of species of plants. Typically, tannins are applied to cellulose fibers preceding the mordant.
The Procedure
Collect water samples in mason jars
Test water with test strips
Add ½ tablespoon of ground Rubia tinctorum to each jar - allow to rest overnight
Scour fabric samples in 1% weight of fabric (WOF) Prosopol
Mordant samples in 15% WOF alum
Start dye process - place water sample (now dye bath) and fabric samples in stainless steel pot, slowly rise temperature over 1 hour, careful not to boil, then roll simmer for 10 minutes - rinse samples in tap water - dry flat
Return cool dye after-baths to jars
Double-strain jars of their ground madder root dye stuff


Results
Control Tests
To better understand the results from round 1 and round 2, I conducted a separate set of control tests. I used distilled water as my base for all control sample tests and added various substances to each jar, then added madder root to create a dye bath. This way, I would know what was in the water of each dye bath and could compare these results to the results of round 1 and round 2. I included substances that I assumed could be present in the collected water samples or substances that would create similar conditions, based on the information I gathered from both the LPDES permits and on the possible natural composition of the water. Due to access and safety reasons, I wasn’t able to include many of the most toxic substances that are permitted and routinely discharged into the Mississippi River and back swamps in Cancer Alley. Instead, I included substances that would tamper with alkalinity, pH, hardness/softness, as well as metals, tannin, salt, and even a synthetic fertilizer for things like manufactured phosphorus, nitrogen and ammonia. A table of the substances and water quality test strip results from the control samples are below.

Control sample results pictured with their afterbaths.
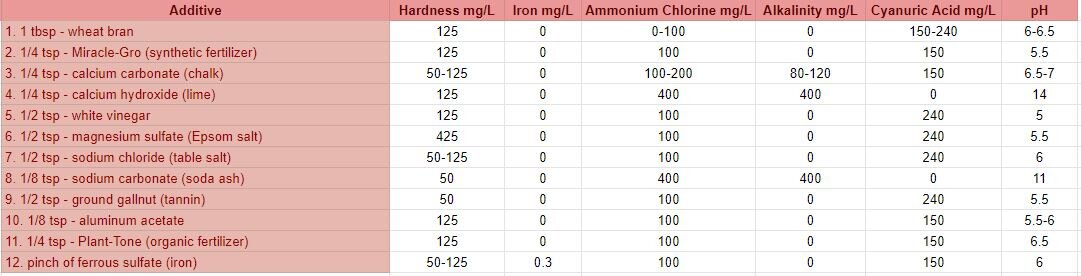
wheat bran - high in phosphorus
Miracle-Gro (synthetic fertilizer) - ammoniacal nitrogen, urea nitrogen, phosphate, soluble potash, boron, copper, iron, manganese, molybdenum and zinc *I do not advise dyers to attempt to use Miracle-Gro (or any fertilizer) in their dyebaths as heating large quantities can cause an explosion.
calcium carbonate (chalk) - increases alkalinity, hardness and pH of the water
calcium hydroxide (lime) - increases alkalinity, harness and increases the pH significantly
white vinegar - lowers the pH
magnesium sulfate (Epsom salt) - magnesium is often found in hard water
sodium chloride (table salt) (also included calcium silicate) - increase water salinity
sodium carbonate (soda ash) - increases alkalinity and pH
ground gallnut (tannin) - tannins are found in nature: barks, leaves, seedpods, leaves, and nuts
aluminum acetate - a metal salt and common mordant
Plant-Tone (organic fertilizer) - ammoniacal nitrogen, soluble and insoluble nitrogen, phosphate, potash, calcium, magnesium and sulfur
ferrous sulfate (iron) - metal salt and common mordant/assist, often results in dull, grey-black dye colors
Results, All Together
Observations
I am a natural dyer, not a chemist, a geologist nor an environmental scientist. But the more I accumulate knowledge from all of these disciplines, the better I’ll be able to understand my dye results. I welcome anyone with a background in or enthusiasm for these fields to contact me or comment below with any insights they may have about this project.
There is historical and contemporary literature on how variables such as pH, alkalinity, hardness, certain metals, and tannins may affect a natural dye bath. However, because there aren’t any modern examples of dyers using more toxic elements and compounds such as arsenic, cadmium, mercury, silicon oxide, chloride, nickel, ethylene glycol, as well as other organic chemicals often present in the areas water bodies, and because there’s no safe way for me to specifically test these in a control dye bath, it’s more difficult to make assumptions and draw conclusions about my results based on their possible presence.
I believe there are various and many substances present in the collected water samples that are causing the color shifts in my final dye results. I don’t believe it’s possible to point to just one thing, it is a combination. For example, pH values can inhibit or accelerate chemical reactions, meaning the same substance may have a different effect on the dye outcome depending on the acidity or basicity of the solution. Looking at the final dyed results, from water sample to water sample, you can see there are variations in color (a spectrum of red to pink to orange to purple to brown), value (lightness and darkness) and temperature (coolness and warmness of color).
In my observations, I noticed that there were groups of samples that dyed a bit darker throughout, those that dyed a bit lighter throughout, and two outliers; sample B and sample B2.
According to the water quality test strip results, as well as the control test results, it seems like alkalinity, a slightly higher pH, or of course, the presence of metal salts, in some way accounts for the lack of color attaching to the fibers. Additionally, calcium carbonate (often present in hard and alkaline water) will also attach itself to some dye particles present in madder root, rendering them unavailable for the fabric. Basic solutions typically allow any metal salts present to bind to dye particles, rendering them unavailable for the fabric. By contrast, it’s possible that a more acidic solution will block the bond between a metal salt and dye particle, leaving them both available to be taken up by the fabric. Tannin is by nature more acidic, so the presence of tannin in the water will not only block the bond between a metal salt and a dye particle, but is also an important binder for natural dyes, especially on cotton fabrics, as it facilitates a bond between the fiber and the mordant, as previously mentioned.
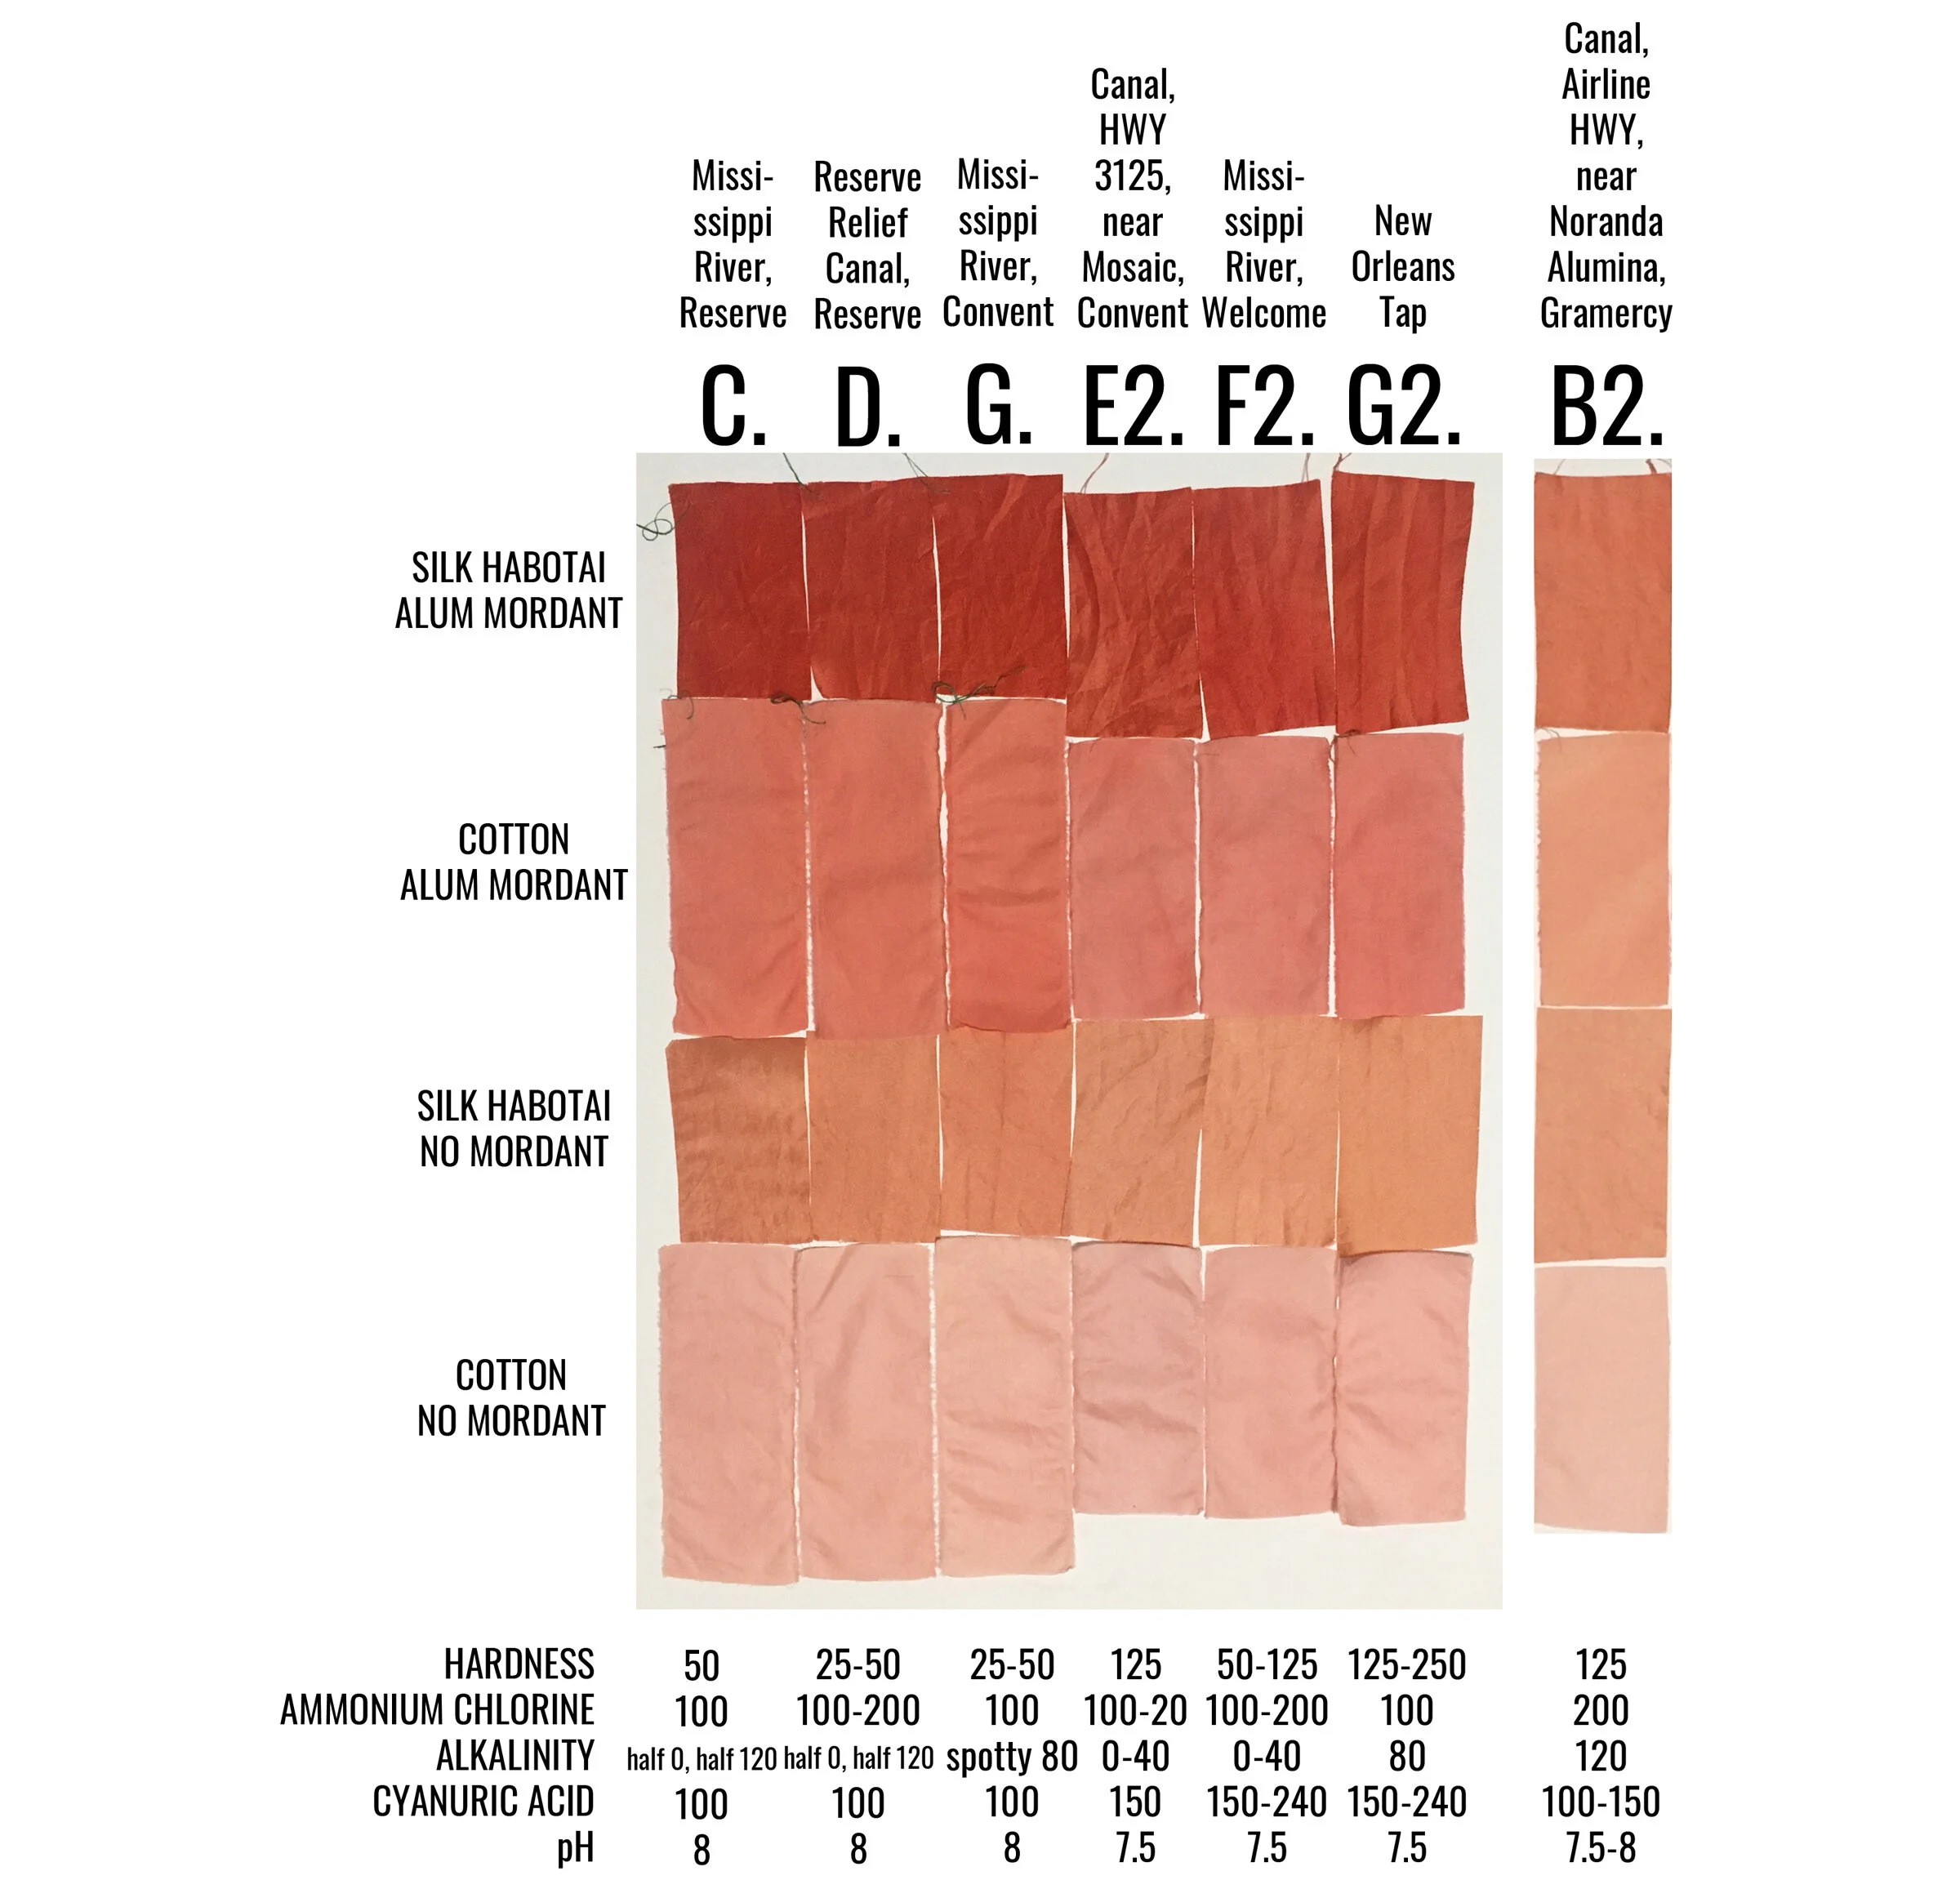
Samples C, D, G, E2, F2 and G2 were all similarly lighter across the board. All six have a pH of 7.5 to 8 and indicate some level of alkalinity above 0 mg/L. These samples were collected in the following types of bodies of water: Mississippi River, local canals, and NOLA tap. The Mississippi River is a direct dumping ground for wastewater discharges from outfalls from every plant located on its banks - varying chemicals and compounds at varying levels. The canals are man-made channels used to move water into the neighboring swamps and many are also direct dumping grounds for various outfalls. New Orleans (NOLA) tap, and actually all tap water going to communities along the Mississippi River, come from the Mississippi River.
Sample B2, the lightest sample from both rounds, has a pH of 7.5-8 and a hardness and alkalinity reading of 125 mg/L and 120 mg/L respectively. This water sample was collected from a canal that connects to the Blind River swamp area, directly across the highway from Noranda Alumina, a bauxite refinery that produces alumina, a starting material for the smelting of aluminum metal and is an active agent in chemical processing. (The common natural dye mordants, alum and aluminum acetate, are also derived from bauxite.) Noranda holds a LPDES permit to discharge various substances into the Mississippi River and Blind River swamp area. According to the EPA’s most recent Toxics Release Inventory, in 2019 they released 11,142 pounds of zinc (81%), lead (17.9%) and mercury (1.1%) into the waterways. Dye practices show that aluminum and zinc will attach to dye particles, rendering them unavailable to attach to any fiber. This facility also the largest emitter of Mercury into the air in all of Louisiana.
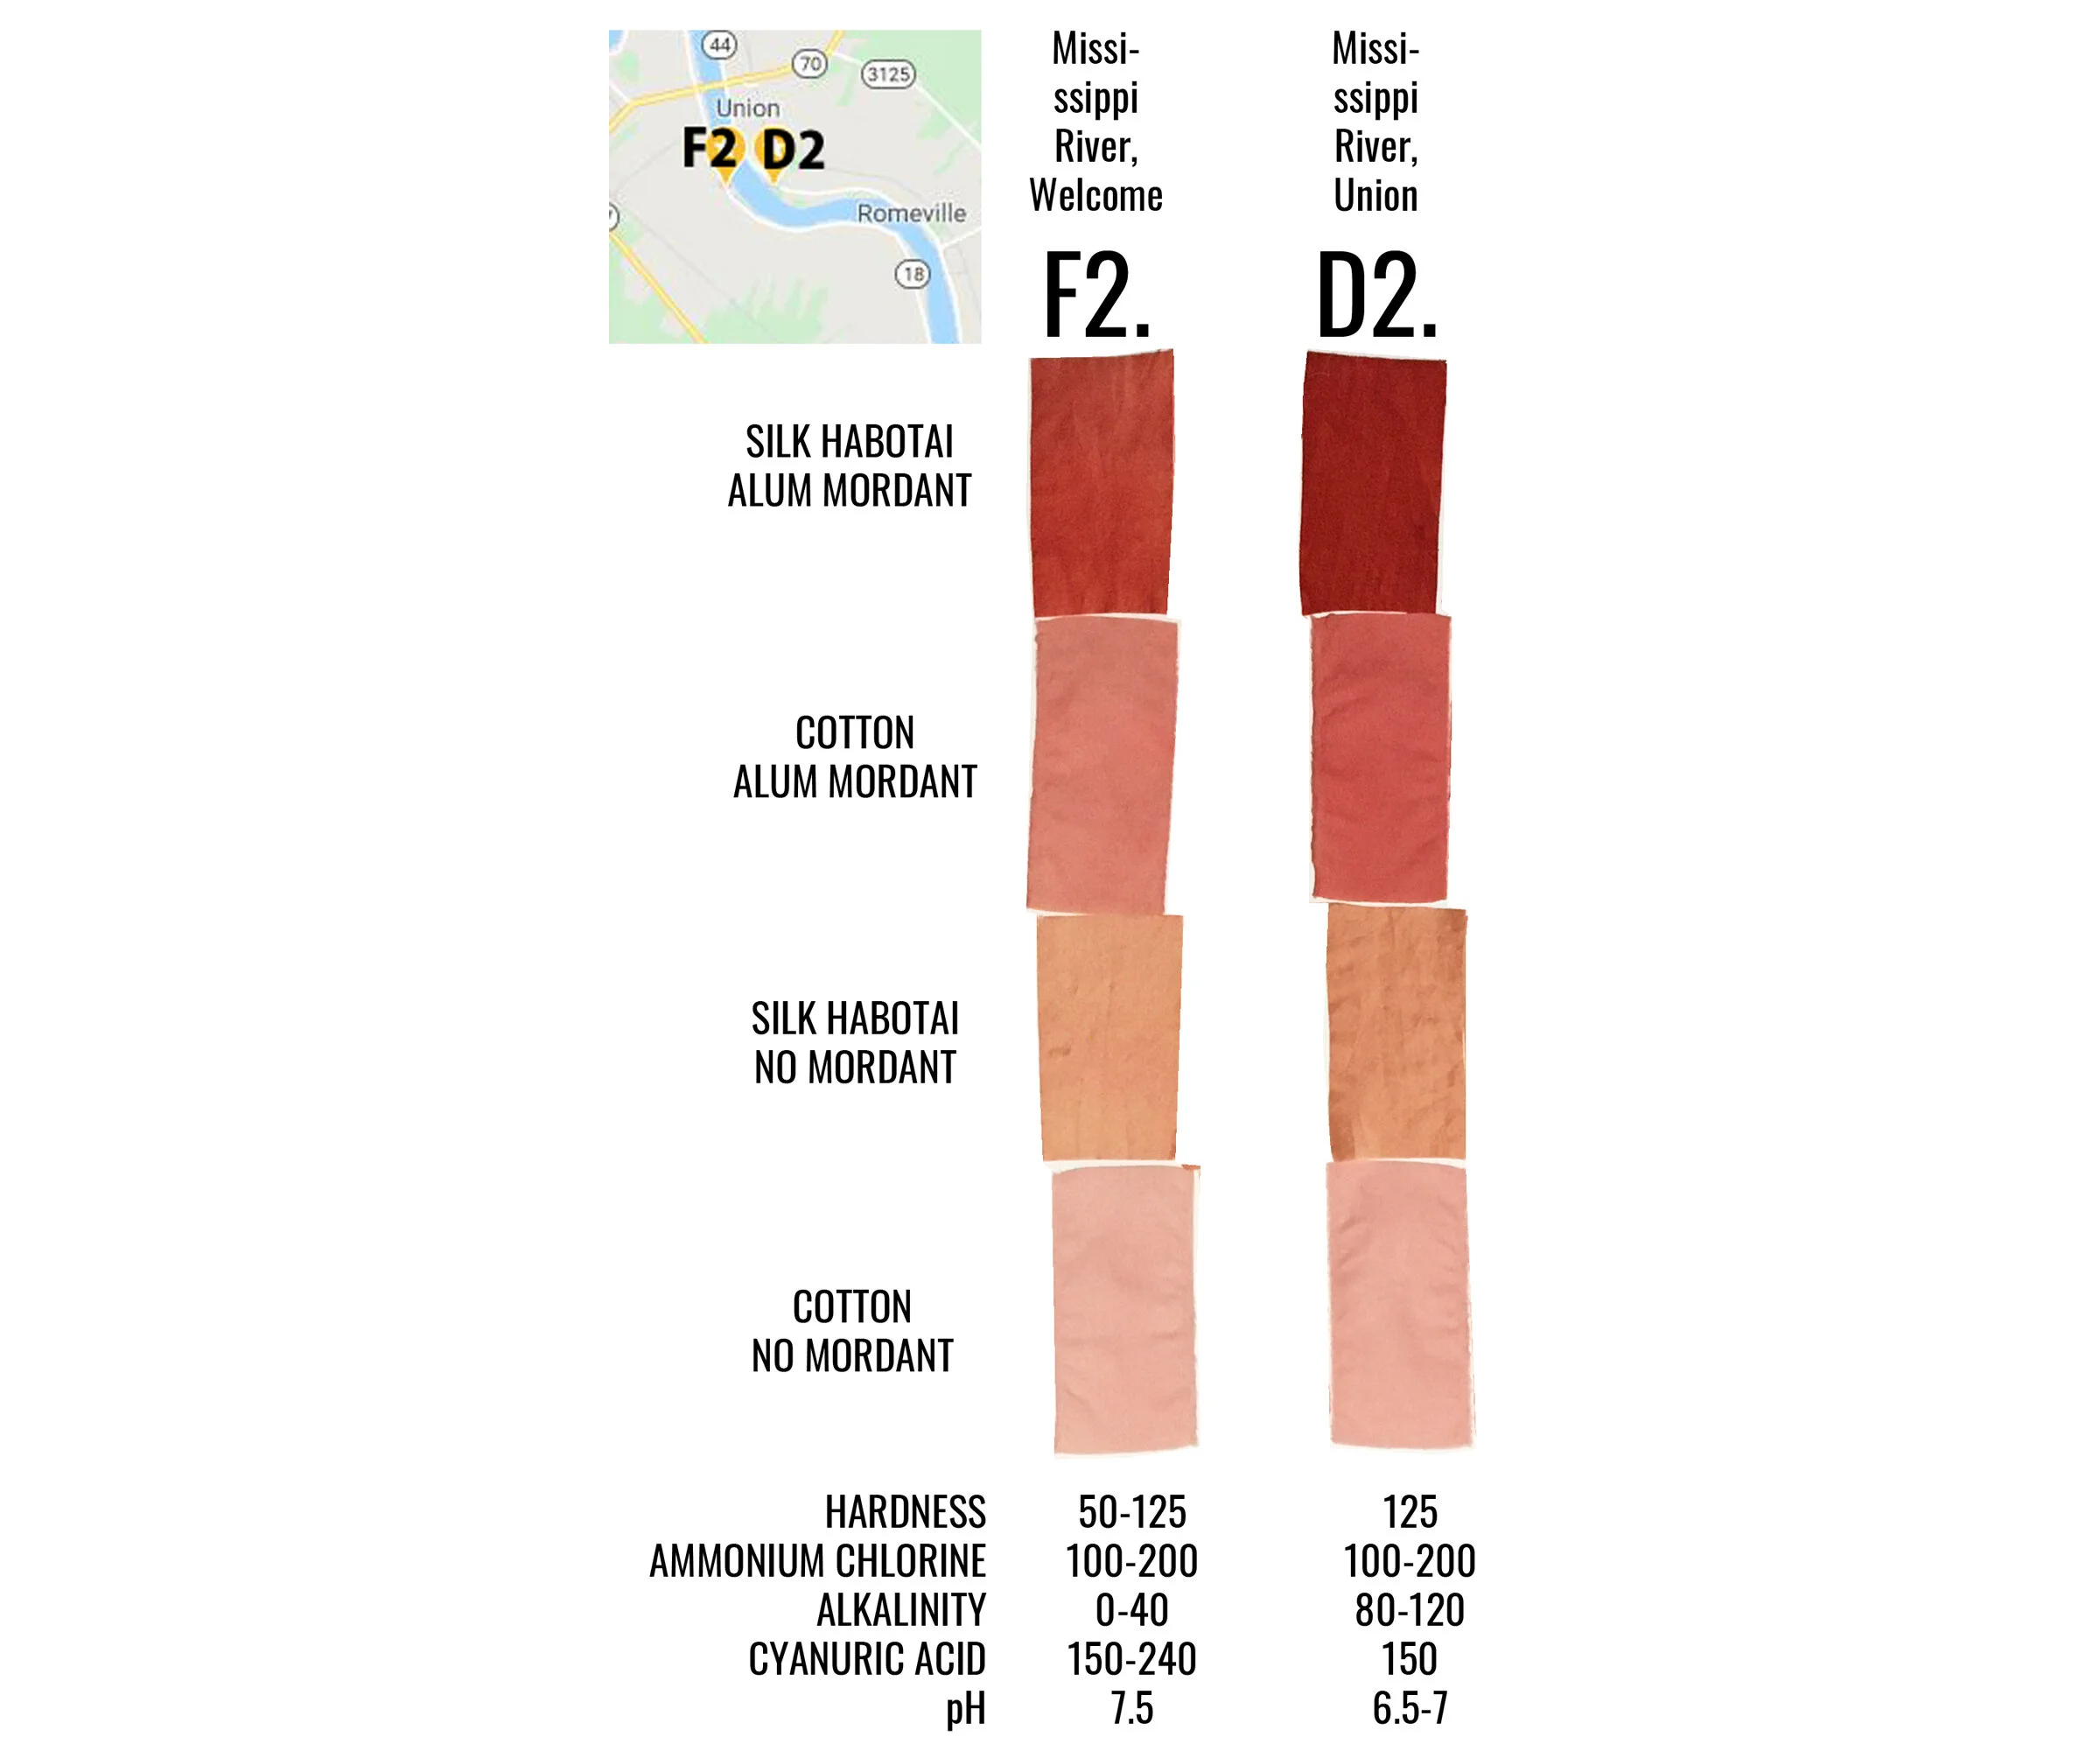
Interestingly, samples D2 (Mississippi River, Union) and F2 (Mississippi River, Welcome) were collected one day apart from a very similar point of the river but from opposite banks, yet sample D2 absorbed more dye while sample F2 did not. I would think that water samples coming from the same river around the same time would have the same dye outcome. Mosaic Faustina Ammonia Plant, which manufactures pesticides, fertilizer and other agricultural chemicals, is directly upstream on the same bank as where sample F2 was collected. According to the EPA’s most recent Toxics Release Inventory, in 2019 Mosaic Faustina released 44,114 pounds of ammonia (98.9%), zinc (.5%), nickel (.5%), lead and methanol into the waterways. It should be noted that there are two Mosaic plants in the area, Mosaic Faustina and Mosaic Uncle Sam.
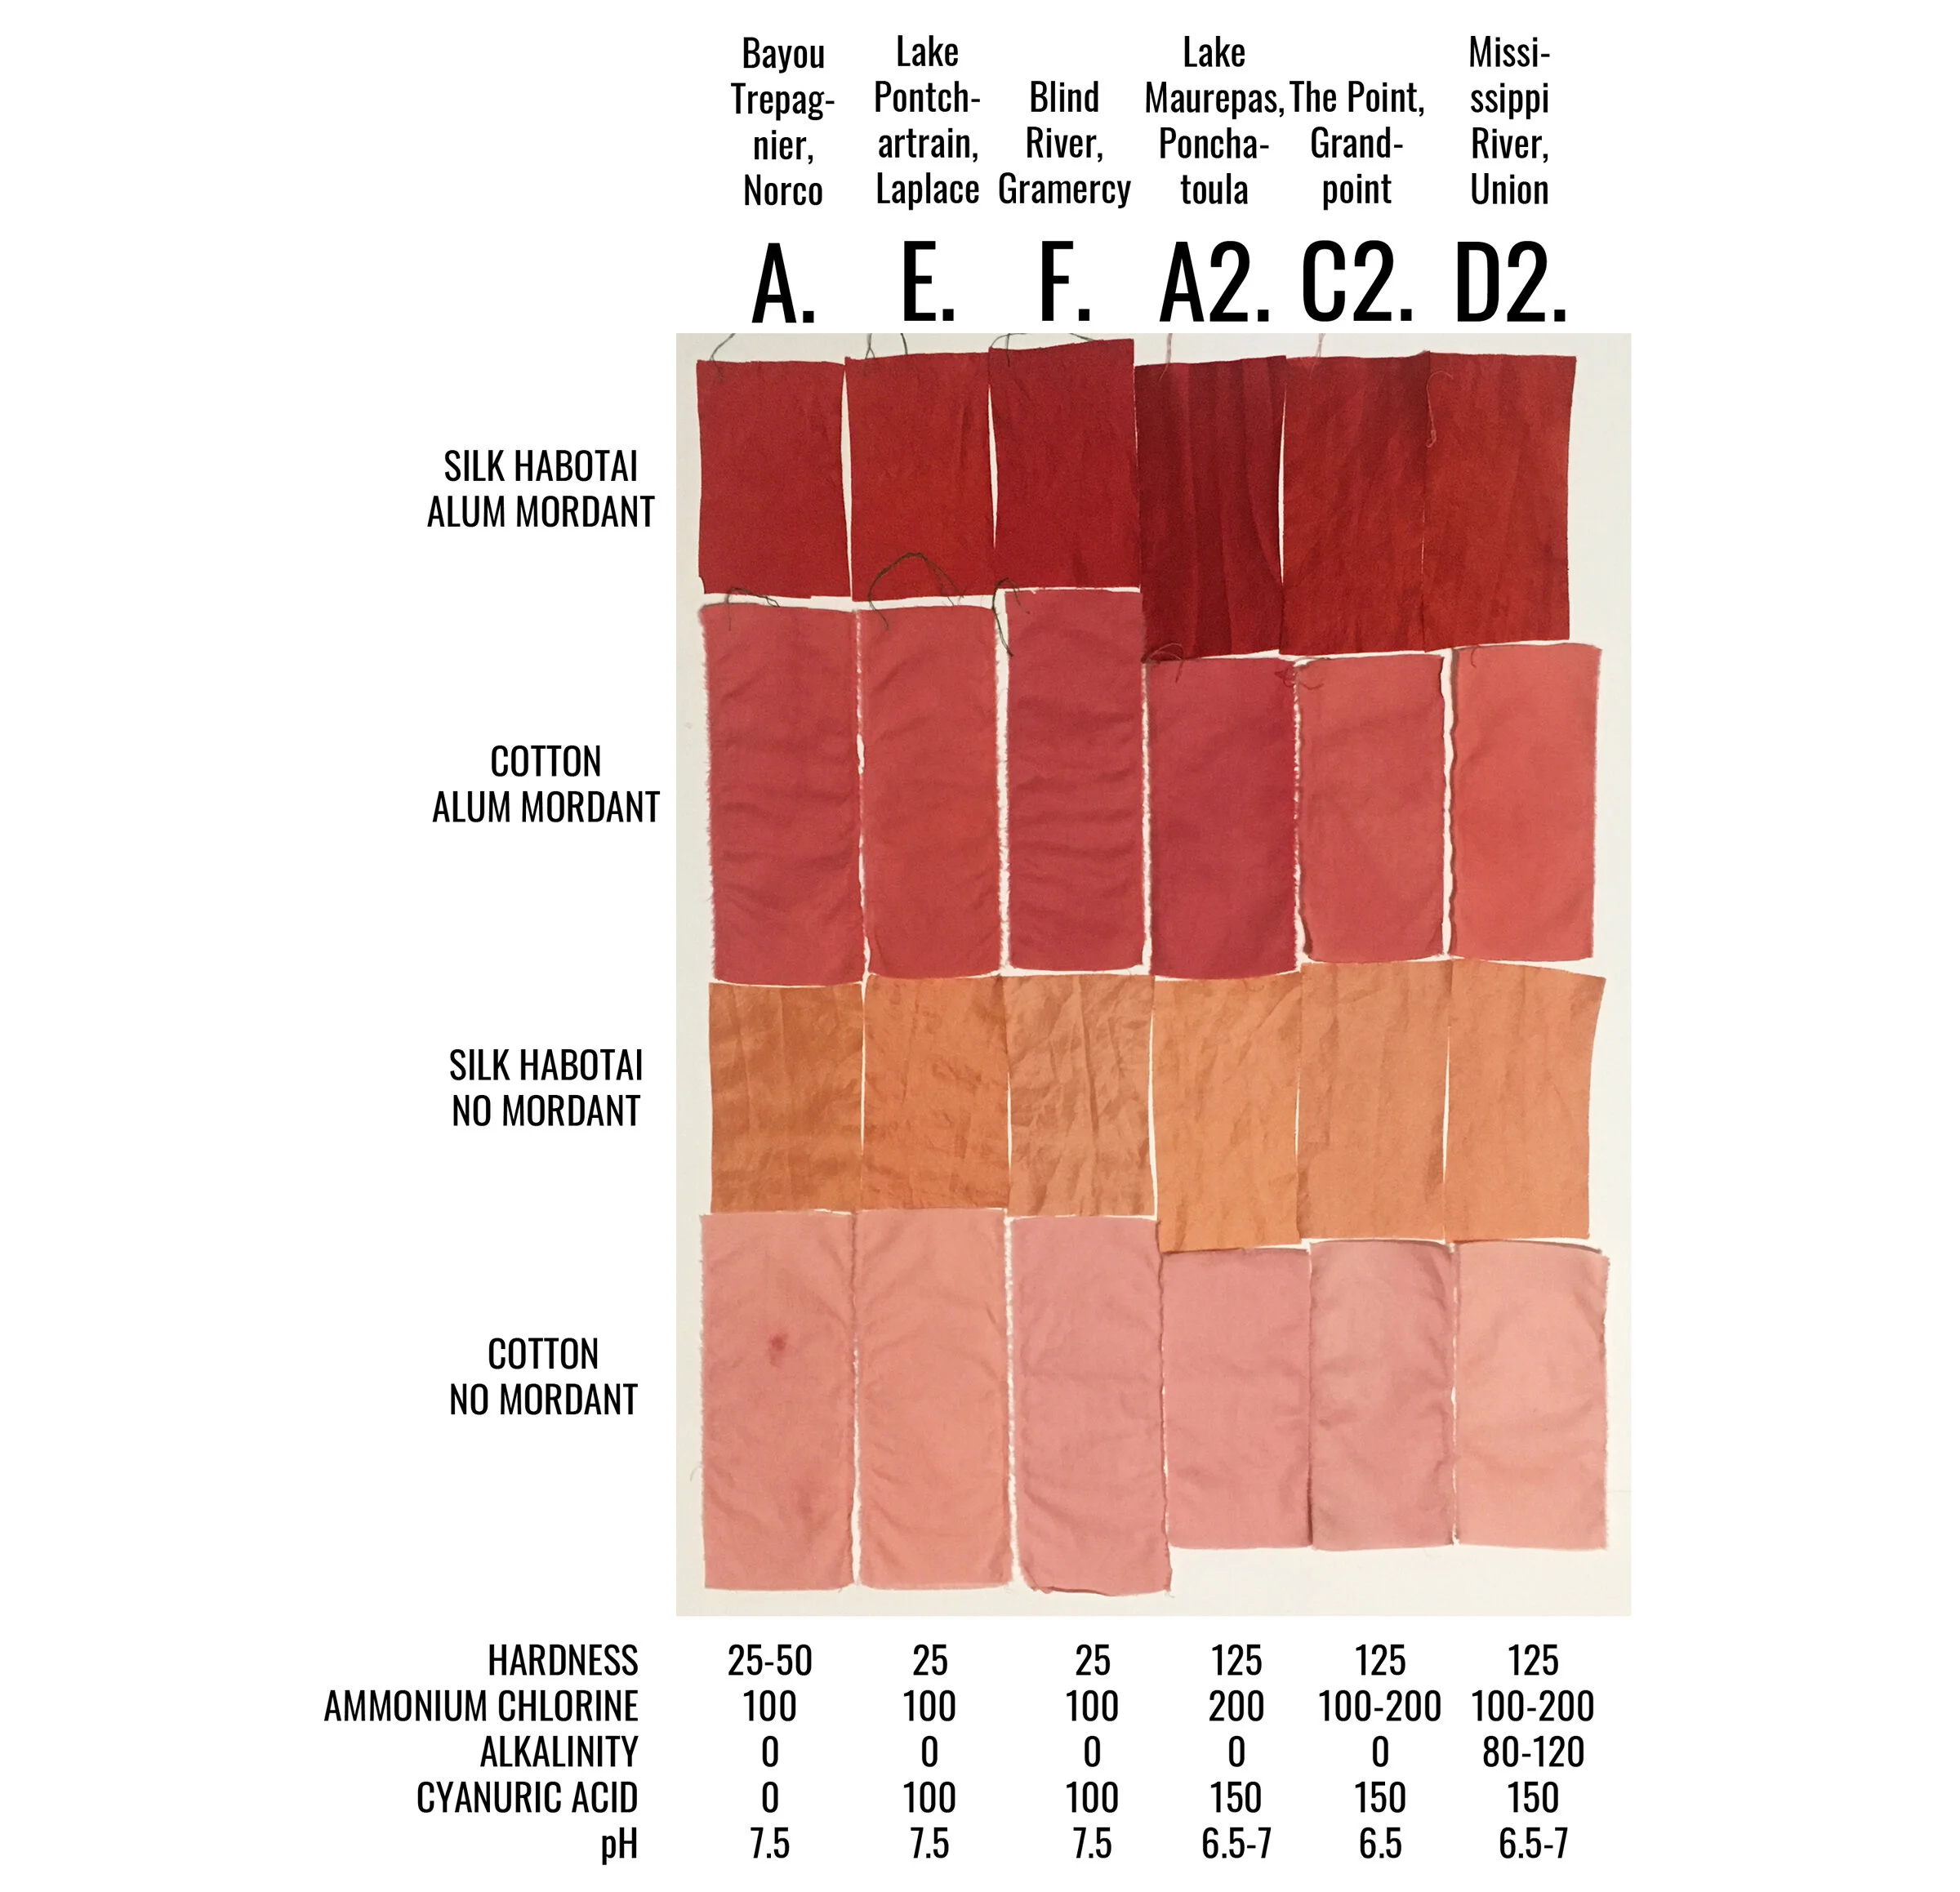
Samples A, E, F, A2, C2 and D2 are darker across the board. All except for sample D2, collected from the Mississippi River, recorded no alkalinity. It’s interesting to me that sample D2, with a recorded alkalinity on the higher end, 80-120 mg/L (while sample B2, the lightest sample so far, also recorded an alkalinity of 120 mg/L) dyed in the darker spectrum. All other samples that recorded any level of alkalinity dyed much lighter across the board. This shows me, again, that there are a combination of things at work here. In those that were sampled in the second round, all three have a pH that is slightly acidic, while those from the first round had a pH of 7.5. Aside from sample D2, all of these water samples were collected from bodies of water that move slower and likely contain more tannins than the much faster flowing Mississippi River.

Sample B (swamp near Barataria Preserve) produced dull purples and browns. When I collected this water sample, the water was thick with duckweed. I tried to get as little duckweed in the jar as possible, but some slipped in. Instead of straining out the duckweed, I left it in the jar until right before I added the madder root, about three months after collection. I recently read that duckweed is a very effective bio-accumulator, often removing excess nutrients and toxic metals from the water. I believe the result is dark/muddy because of the presence of iron. I don’t know if the soaking/somewhat decomposing duckweed released iron, creating a slight concentrate in the jar, or if the iron was just this present in the water where I collected the sample. Either way, the duckweed would have accumulated this iron from its source water. It is also possible that the soaking duckweed released tannins. This sample was also collected from a swamp that is directly connected to the Gulf of Mexico and probably had some saltwater intrusion. You can see similarities across this sample, the control iron sample and the control salt sample.

While studying my results, I realized that the water quality test strip results for the chalk control sample and sample D2 were nearly identical, yet their dye results were not. The chalk sample is overall lighter and warmer than sample D2. This again shows that there are various substances at work, some that I was not able to test for.
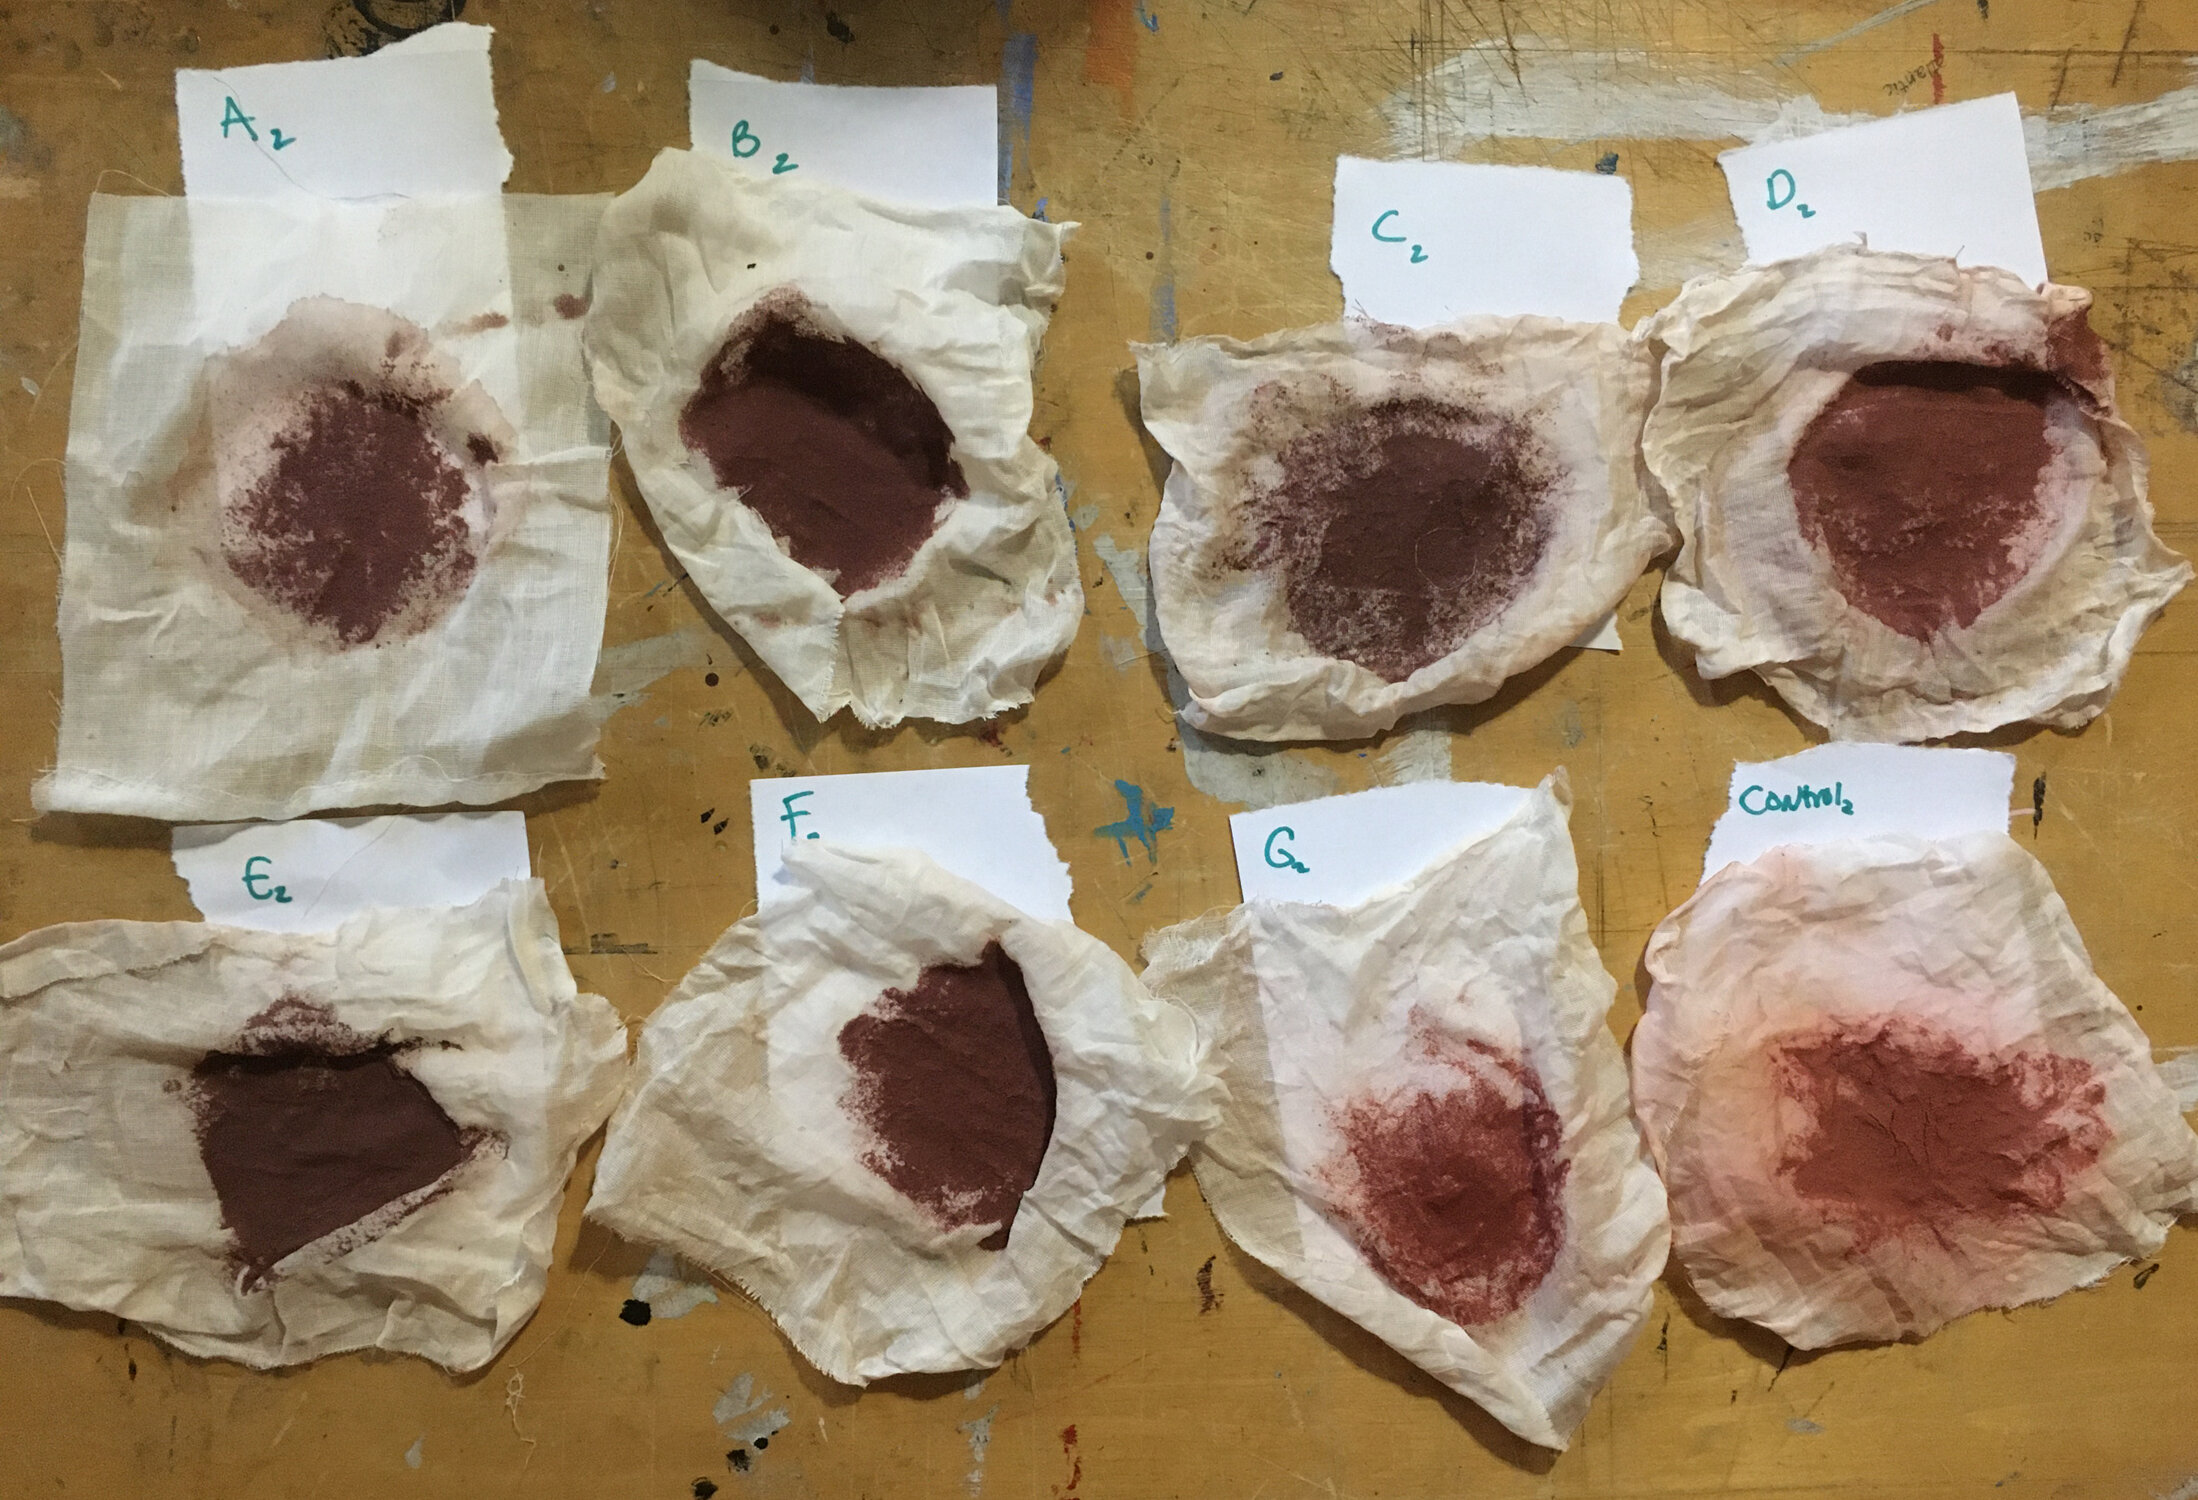
After the dyeing of the round two samples was complete, I double strained the dye baths. This is the cheese-cloth after the second strain. Notice how both the control and sample G2 (NOLA tap) are both a much brighter red, closer to the actual color of the madder root itself, while the others are more brown/maroon.

Above is a comparison of the two fertilizer samples. The synthetic fertilizer, Miracle-Gro sample is much more cool and dull than the organic fertilizer, Plant-tone, sample.
The Nature of Water in Cancer Alley
Since starting this project, I have attempted to better acquaint myself with the nature of the water in Cancer Alley through conversations with environmental scientists, sifting through available data online about the geology of the area, introducing myself to EPA water quality standards, scrolling through individual plant LPDES permits and Discharge Monitoring Reports (DMRs), the LDEQ’s Environmental Regulatory Code, state water quality tests, and the 2018 Water Quality Integrated Report. This research is on-going.
I have found that the water quality varies considerably throughout the year based on the growing season (agricultural runoff such as pesticides and nutrients from both local and upstream sources), weather (temperature and precipitation) and industrial discharges (a plethora of chemicals, compounds and other minerals).
In general, the Mississippi River is naturally rich in minerals because its water travels a very long distance from its headwaters in Minnesota, carrying with it a myriad of minerals along the way. This makes the water generally hard, generally alkaline and according to historical data, a pH between 7.2 and 8. In lieu of more recent data, based on water quality tests by the LDEQ taken from 1966-1990 of the Mississippi River in Lutcher, Louisiana, the average alkalinity was 106.5 mg/L, although it varied widely from test to test. These same water tests showed levels of arsenic, cadmium, chloride, chromium, copper, lead, mercury, kjeldahl nitrogen, phosphorus and sulfate varied widely from test to test. As I’ve mentioned, the Mississippi River is also the catchment for multiple outfalls from every plant located on its banks. The water from the Mississippi is mostly contained within the levee banks, unless the level of the river becomes dangerously high, prompting the opening of the Bonnet Carre Spillway as a pathway for the Mississippi waters to be emptied into Lake Pontchartrain.
By contrast, Blind River and it’s connecting swamps, bayous, rivers, lakes and canals, which have been cut off from the nutrients, minerals and sediment of the Mississippi River by the levee systems, are generally slightly more acidic due to the primary soil type being more acidic. According to historical data the water in Blind River swamp is typically at a pH of between 6.4 and 7.5. Based on water quality tests by the LDEQ taken from 1978-1998 and from 2010-2012 of Blind River, very close to where I took my first Blind River water sample, the average alkalinity was 59 mg/L. These same tests showed the levels of calcium, magnesium, arsenic, cadmium, chloride, chromium, copper, iron, lead, mercury, manganese, nitrogen and nickel all widely fluctuated from test to test, sometimes by staggering amounts. It is probable that spikes in these values are due to industrial activities.
The industry motto is “the solution to pollution is dilution.” The state is required by the EPA to develop Total Maximum Daily Loads (TMDLs) for each body of water receiving discharges. It’s essentially a pollution budget, the maximum amount of pollution that can be released without causing the body of water to be impaired. If a body of water becomes impaired, the state must create a more stringent TMDL. But, pollution doesn’t just disappear when it’s diluted. It has to go somewhere. Some pollutants may change form, become attached or separated from particles, react with other molecules, or change by the action of bacteria present in the water body. Many pollutants end up in the soil or sediment, are flushed further downstream, or are accumulated in aquatic plants and animals. Pollutants such as DDT, PCBs, mercury and dioxins, which are all permitted for release in the region, bioaccumulate and persist in the food chain, increasing in each organism, becoming more toxic. Many pollutants including pesticides, industrial chemicals and pharmaceuticals mimic hormones and can interfere with the reproduction of birds, fish and humans. So, just because a pollutant isn’t registering in the ever-fluid, ever-changing surface water, it doesn’t mean that it doesn't still persist in that environment. I would be interested in finding soil sample tests from the sediment at the bottom of the various bodies of water where pollution is discharged.
Conclusions
I am interested in continuing this project, yet overall, I’ve learned that the results of these tests won’t give me a definitive answer about what is in the water. Especially because some of the most toxic pollutants that are released into Louisiana’s waterways, may not have any effect on a madder dye bath at all.
For instance, could radium-226 affect the color outcome of a Rubia tinctorum dye bath? Could mercury capture dye particles like other metal salts? Could dichlorobenzene sadden colors, sulfuric acid brighten them, does toluene shift cooler, methylene chloride shift warmer, or DDT increase light fastness? What about other endocrine disruptors like lead, dioxin, and arsenic do these increase dye absorption? There is no safe way for me to test these questions.
Although madder may not be the best indicator of these compounds, I do believe there is value in continuing these tests. A few future iterations of these tests may include; collecting samples from various points of the same body of water in a single day, collecting water samples from the same point each month over a long period of time, collecting soil samples with water samples for a set of tests, simply continuing to test new sites comparing results to similar water source types over time and also using the water sample as a mordant bath, rather than the dye bath.
I believe this experiment as a whole opens up an important conversation about permitted (and sometimes unpermitted) water, air and land pollution in Cancer Alley.
A continuous flow of even trace amounts of very toxic chemicals will have an adverse effect on a community over time. Especially since some of these elements and compounds accumulate rather than dissipate. Because there is long term exposure to both air and water pollution in Cancer Alley, coming from a multitude of sources, it is difficult to pinpoint the cause of an ailment or a disease to a specific plant operation or chemical. There’s no big event, this pollution is quiet and it’s pervasive. According to the EPA’s Toxics Release Inventory, these plants are releasing hundreds, thousands and often even millions of pounds of toxic chemicals a year. Chemicals that are proven carcinogens, endocrine disruptors, and compounds that negatively affect cardiovascular, reproductive, developmental, renal, neurological, hematological, ocular and respiratory systems.
In this region of Louisiana, both the environment and the people are being poisoned and displaced. Why is it that Louisiana is inviting more of this kind of industry to these already pollution-saturated communities? In 2014 the St. James Parish council changed the land use plan for the 5th District, which has a predominantly Black community, from Residential to Residential/Future Industrial without consulting or receiving consent from the residents, laying out the welcome mat for more industrial polluters.
Right now, residents in St. James (led by the organization RISE St. James) are battling state and local governments to block the construction of Formosa, a plastics manufacturing complex, which will be one of the largest and most expensive industrial projects in the state’s history. The new complex will include 14 separate production and utility plants on more than 2,300 acres. The facilities will produce polyethylene, polypropylene, polymer and ethylene glycol (polyester, antifreeze, artificial turf and other single-use plastics). Formosa will destroy over 100 acres of wetlands, desecrate historic cemeteries believed to contain the remains of people who were enslaved, and be built just one mile away from a local elementary school. The project will emit 800 tons of toxic air pollution each year, doubling toxic air emissions in St. James Parish and more than tripling the levels of cancer-causing chemicals in the community. Formosa will be one of the largest industrial sources in the state for benzene, formaldehyde, and ethylene oxide - all known carcinogens. It will be one of the largest sources of ethylene oxide in the country.
But, Formosa won’t only be bad for St. James residents, it will be bad for everyone. On an alarmingly warming planet, this single complex will constitute the largest new source of greenhouse gases from a U.S. petrochemical complex since at least 2012. The complex will release 13 million tons of carbon pollution per year. Not to mention, it’s sole purpose is to produce single-use plastics. Formosa has been named a ‘serial offender’ by a Texas judge for releasing billions of small plastic pellets, called “nurdles,” into Texas waterways. Our oceans are already over-run by microplastics that eventually degrade, releasing pollutants into the water; get consolidated together by currents, blocking the sunlight, inhibiting the ability for organisms to complete photosynthesis; or find their way into the food chain, as they are consumed by birds and fish.
Formosa has not yet been built! Please help the fight against Formosa by supporting and donating to on-the-ground organizations like RISE St. James and the Louisiana Bucket Brigade, signing these four petitions: Louisiana Bucket Brigade, Healthy Gulf, Color of Change, Change.org, spreading the word about Cancer Alley and learning more about the ongoing fight against the petrochemical industry in Cancer Alley and beyond.
Learn more about Formosa HERE. If you’re interested in learning more about Cancer Alley, I suggest picking up a copy of "Petrochemical America,” by Kate Orff and Richard Misrach. To learn more about the petrochemical industry in general, the podcast “Drilled” by Critical Frequency is a great place to start (start from Season 1). Other organizations supporting the fight in Cancer Alley are Healthy Gulf and The Center for Biological Diversity.
A big big big huge thank you to natural dyers Erika Molnar, Madeleine McGarrity and Catharine Ellis, and environmental scientists Andrew Whitehurst, Scott Eustis and Irvin Louque and many others who’ve answered my questions, pointed me in the right direction and helped me to solve a few puzzles!
Suggestions, Questions, Comments? Email me!